BCUBE and BCUBE_K
The BCUBE and BCUBE_K functions both retrieve data from a Board Data model or Cube for a set of specified coordinates (named Entity members). They are functionally equivalent to each other with one single difference: the Selection criteria as specified in the Board platform are either ignored or respected.
Selections are ignored in BCUBE and respected in BCUBE_K
The BCUBE function ignores the Selections that have been applied from either the Sheet or Workbook Selection windows. The Selections are discarded and are NOT applied when the Excel BCUBE retrieves the data. This still allows users the freedom to specify the ‘filtering’ coordinates of the BCUBE formula to suit their current interests.
The BCUBE_K function ‘keeps’ the active Selection and retrieves data accordingly with that Selection still applied. This allows users to display data without needing to specify every coordinate every time, but only those which are not already defined in the Board Selection.
Member coordinates in the BCUBE formulas
The coordinates of the functions can be identified either as a sequence of member values, or as a range of member values (but not both).
Use commas to separate a sequence of members of the same Entity, e.g.
"Entity1=member_code1,member_code2,member_code8,member_code9"Use a colon to define a range, e.g.
"Entity2=member_code30:member_code40"Use semi-colons to separate multiple entities from each other, e.g.
“Entity1=member_code1;Entity5=member_code55”
The syntax of the BCUBE and BCUBE_K functions are:
  =BCUBE("Data_model","Cube_Name", "Entity1=member_code1,member_code2;Entity2=member_code30:member_code40", "Functions")
=BCUBE_K("Data_model","Cube_Name", "Entity1=member_code1,member_code2;Entity2=member_code30:member_code40", "Functions")
The "Functions" are optional parameters, separated from each other with semi-colons, that are used to modify the data queries and are described in Time Functions below.
The code example below retrieves the value from the "Echo" Data model in the "Sales Packs" Cube.
It filters the data to be retrieved with the coordinates of: the 3rd and 4th quarters in 2012; for Customers with member codes C02134 and C04345; from the previous period (pp) given the current Selections on the Sheet.
=BCUBE_K("Echo", "Sales Packs", "Quarter=201203, 201204;Customer=C02134,C04345", "pp")The "SetSelection" and "SetSelectionwithRefresh" functions update the sheet selection criteria, so they are recognized by BCUBE_K, but not by BCUBE which always retains and respects the original Selections.
In the example clip below, there are 3 different examples using BCUBE and BCUBE_K:
The first example uses BCUBE, specifies the Data model name and Cube, but does not respect the Sheet Selection, so the data summarizes data from ALL years.
The second example uses BCUBE_K, specifies the same Data model name and Cube, but it does respect the Sheet Selection, which filters for the year 2010.
The third example uses BCUBE_K and adds an additional "Coordinate" that acts as a filtering selection in addition to any active Selections. The data displayed is an intersection of the two Selections.
If the coordinates of the formula are not coherent with the active selection (e.g. 2 conflicting filters applied to the same Entity), no data will be retrieved and the cell will display "0".
In our example, =BCUBE_K("Echo", "Sales Packs", "Year=2012") would return a zero value, because none of the data can be in BOTH 2010 and 2012.

BCUBE & BCUBE_K Time Functions
The "Functions" parameter of BCUBE and BCUBE_K is used to calculate totals or retrieve data from other periods based on certain time variables, as described in full detail in the Time functions section of the Data Block settings.
Multiple dimensions are necessary
Time functions can not be applied to Cubes with only one dimension, nor to Cubes that are structured by a custom Time Entity.
The available time functions are the same as in the Layout Editor:
"pp" = previous period
"py"= previous year
"ycv" = yearly cumulated value
"ymt" = yearly moving total
"yma" = yearly moving average
"lastvalue" = last value
"fy" = fiscal year
"fy" can only be used in combination with "ycv", separated by a semicolon: e.g. "ycv;fy".
"cycle" = N (the number of periods after which rolling cumulations are reset)
"cycle" can only be used to modify one of “ycv” - yearly cumulative value, “ymt” - yearly moving total, “yma” - yearly moving average, or “lastvalue”, separated by a semicolon and followed by a space and the cycle value: e.g. "ycv;cycle 3".
This number specifies how many of the dimensioned time periods constitutes a single "cycle" for the rolling period calculation.
For example, setting the cycle to 90 on a Cube dimensioned by Day will result in a rolling period of the most recent 90 days.
The relevant time dimensions are those specified in the Axes area of the Layout editor - the time dimension in the Cube structure does not impact the calculations.
If the cycle value = 0, then the calculations assume a cumulation period of 1 year.If the cycle value > 0, then the calculations are applied with the time dimension as defined in the Layout Axis.
"offset" = ±N (the number of earlier or later periods to offset based on the Time Entity for which the Cube is dimensioned)
"offset" can be used in combination with any other time function, separated by a semicolon from a following space and the mandatory offset value: e.g. “py;offset -1”
The time selection is shifted by the specified number of periods. The number of periods may be negative for earlier periods, or positive for later periods.
Examples
To better clarify, here are some examples of some complex formulas and their intended results. Note that a combination of security restrictions, selections or the non-existence of the requested data mean that the formulas might not return any data at all.
py;offset 2
Retrieve data values from 2 years ago for all periods.
pp;py;offset 2
Retrieve data values from 2 years ago corresponding to the period prior to the current one.
ycv;offset 2;cycle 2;fy
Retrieve yearly cumulated values from the financial year that was 2 years ago, resetting to zero every 2 years.
yma;py;offset 5; cycle 1
Retrieve yearly moving averages from the calendar year that was 5 years ago, resetting to zero every year.
ymt;cycle 3;py
Retrieve yearly moving totals from the current calendar, resetting to zero every 3 months.
BSAVE
The BSAVE function writes a new value back into a designated value cell of a Cube.
The BSAVE syntax is as follows:
=BSAVE("New value", "Data_model","Cube_Name","Entity1=member_code;Entity2=member_code1,member_code2")
For example, let's take the Cube "Budget Packs" from the Data model "Echo" and look at the Customer Entity's member ASDA Credit Account (member code "C02312") in 2010.
Let's say that you want to change the value for this Customer in March 2010 (member code "201003").
The new value is 550 and lies in cell B7 of the Excel Sheet.
The BSAVE formula for this example is:
=BSAVE(B7,"Echo", "Budget Packs", "Month=201003";"Customer=C02312")
The BSAVE formula takes the new value "550" from cell B7 and writes it into the Cube, both in Excel but also in the Platform.
When you hit enter, the value is saved although it does not show up in the Excel table. To display it in the Excel table, you must hit "Refresh".
Data entry in Split & Splat at the aggregated level is also supported.
GetSelection
The GetSelection function displays the selection(s) made on the Worksheet where the function is deployed, like the @Selection function in the Board Platform.
The GetSelection syntax is as follows:
=GetSelection("Data_model")
Depending on the Display setting of the Entity (Description, Code, or Description and code), the selection is displayed as follows:
Description: Month: Feb.17, Mar. 17, April 17
Code: Month: 201702,201703,201704
Desc & Code: Month: 201702 Feb.17,201703 Mar. 17,201704 April 17
This function displays up to 12 selected members, then, with more than 12 selections, displays the number of selections like the following: Month: 10/60
SetSelection & SetSelectionwithRefresh
The SetSelection & SetSelectionwithRefresh functions act as a selection on your Excel Sheet/Workbook, specifying Data model, and Entity member rather than using a whole Sheet/Workbook selection.
SetSelection
The SetSelection function makes a selection on your Excel Sheet/Workbook and only displays the selection once refreshing the Sheet/Workbook.
The SetSelection syntax is as follows:
=SetSelection("Data_model","Entity=member_code")
The SetSelection function will replace any existing active selections.
SetSelectionwithRefresh
The SetSelectionwithRefresh function is the same as "SetSelection" except that it automatically refreshes the Sheet/Workbook so you don't have to.
The SetSelectionwithRefresh syntax is as follows:
=SetSelectionwithRefresh("Data_model","Entity=member_code")
The SetSelectionwithRefresh function will replace any existing active selections.
To add more select coordinates to SetSelection or SetSelectionwithRefresh, keep Entities and member codes within the same quotation marks and separated by a semicolon (;) as follows:
"Entity1=member_code1,member_code2;Entity2=member_code,Entity3=member_code1, member_code2,member_code3"
For example:
=SetSelection("Echo","Budget Packs","Month=201003,201004;Customer=C02312,C04916")This syntax will show the selection of the months March and April of 2010 and Customers with the code C02312 and C04916.
MergeMappingDefinition
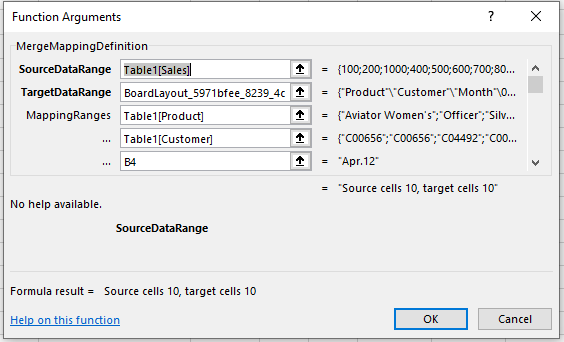
The MergeMappingDefinition function allows users to create a mapping between an Excel Layout (source data range) and a Board Layout (target data range).
The MergeMappingDefinition syntax is as follows:
=MergeMappingDefinition([SourceDataRange];[TargetDataRange];[MappingRange];[MappingRange];[single horizontal mapping range])
[SourceDataRange]. This is a range function where the users can select the Excel range to point to the source data.
Only the values are selected as part of this range and not the actual dimensions.
[TargetDataRange]. This is a range function where the user selects the entire Board Layout in the Excel sheet.
The entire Board Layout is selected. The order of the dimensions shown in this setting is the order to be followed for setting the Mapping ranges in the next step. Data entry needs to be enabled to input values into the Board Layout.
[MappingRange 1-N]. Follow the target order and point (map) the source dimensions in order to save data back to the Board Data model.
The order is important, when the function finds the matching member of the dimensions it will populate the data otherwise it will skip and go to the next cell. Only one column range can be mapped as part of this function and this needs to be the last in the mapping range.
To use the MergeMappingDefinition function, proceed as follows:
Connect to Board.
Add the function to your Excel sheet.
Select the cell range that contains the source data, the target Board Layout, and select the mapping cell ranges accordingly.
The coordinates mapping needs to be defined following the columns order in the target Board Layout. The target Board Layout needs to be flattened and the data entry must be enabled for Data Blocks involved in the process. The Excel sheet must have the “Save/Undo Mode” option switched on. The mapping function can manage only one horizontal mapping range and it must be the last argument in the function. Please, set up the target Board Layout accordingly.
Save to run the function. When the Save button is clicked, the Add-in applies the mapping by transferring data from the source to the target Board Layout. To do this, it scans the source range cells, defines their coordinates, and it searches for the specific row on the target Layout to copy data to.
If no row is found on the target Board Layout the source cell value will be skipped. If the source cell contains no value, the function will write a 0 in the target cell.
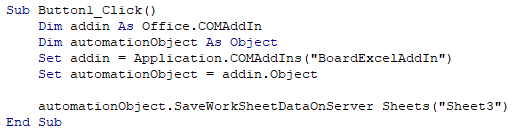
This process can be triggered also from a macro using VBA: it will be triggered when the save function is called (see the code sample below).
Using the function syntax defined below, let's look at an example:
=MergeMappingDefinition([SourceDataRange]; [TargetDataRange]; [MappingRange]; [MappingRange];[single horizontal mapping range])Data mapping example:
SourceDataRange: indicates the Excel range that contains source data.
TargetDataRange: indicates the Excel range that contains the target Board Layout.
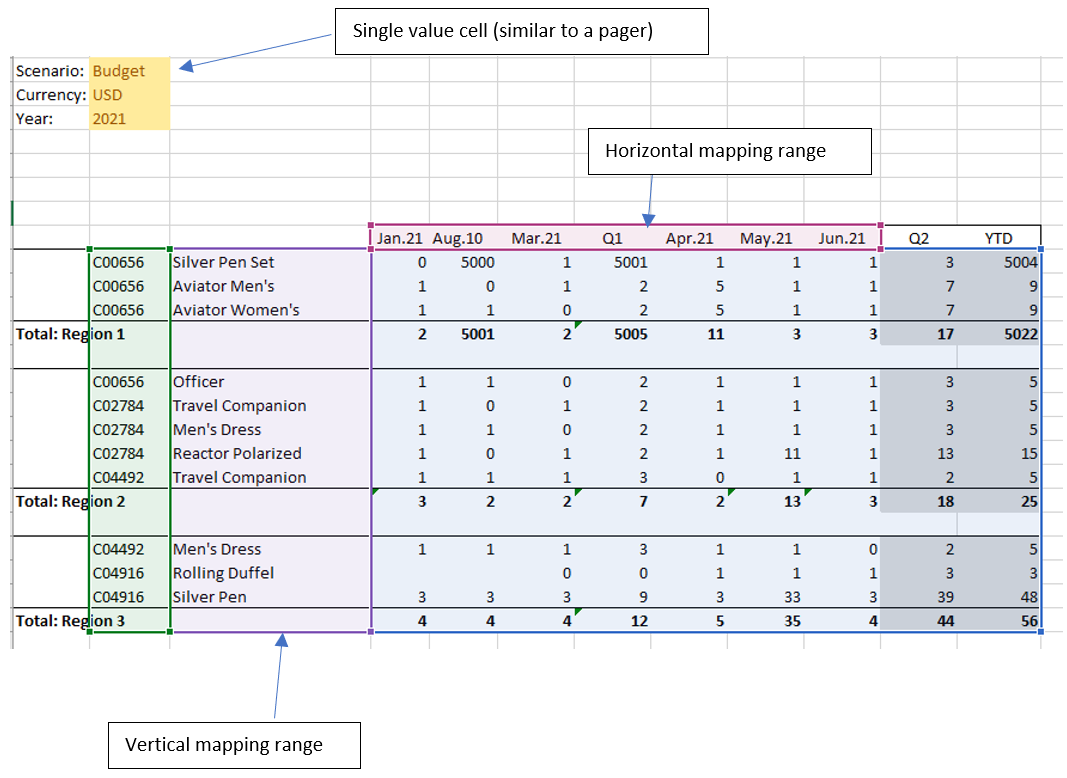
MappingRange: you can specify one or more mapping range; you can map single cells, vertical and horizontal ranges (you can define only one horizontal mapping range and it needs to be the last one in the list); the order of the mappings has to be the same as the columns in the target layout.
After the definition of source and target, you'll have to select mapping ranges in the exact same order of the columns in the target Board Layout.
In our case, the order must be:
Product
Customer
Month

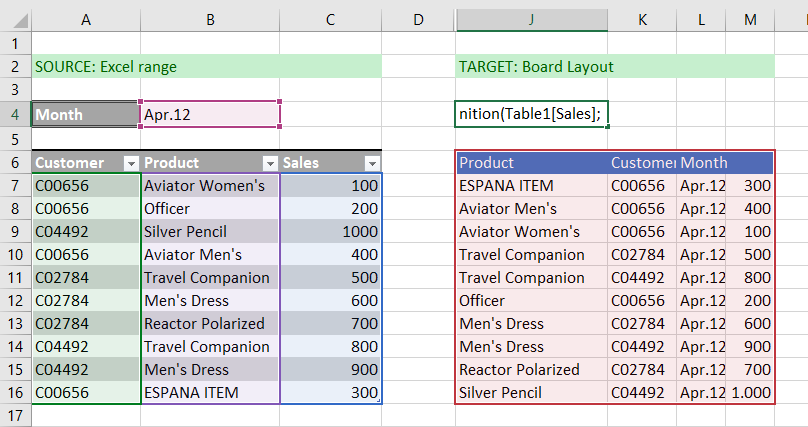
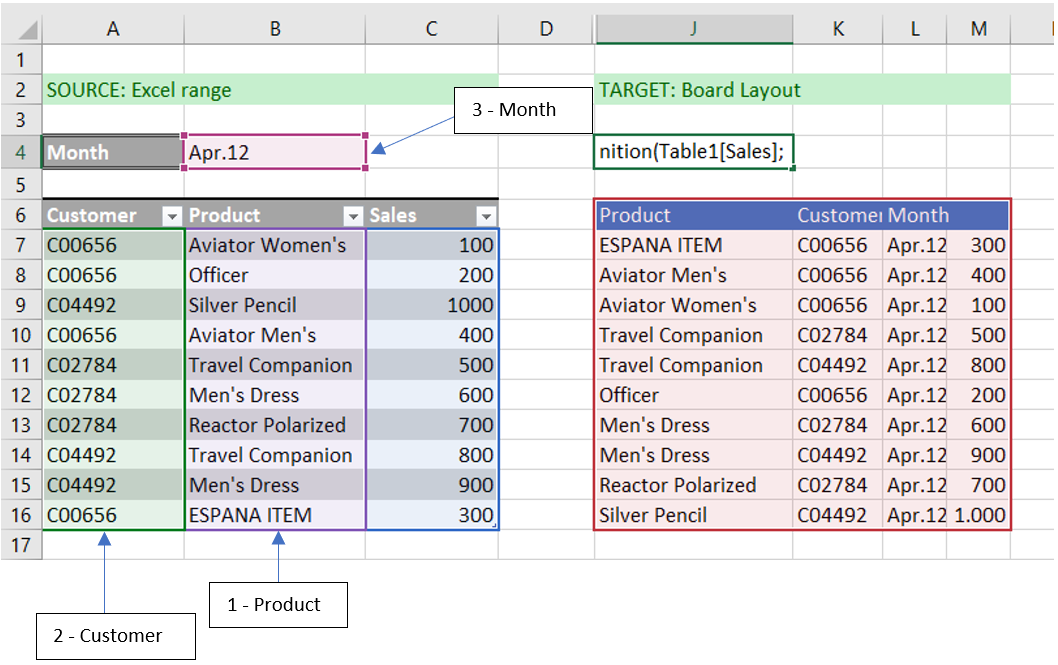
You can map single cells, vertical ranges, and horizontal ranges (you can define only one horizontal mapping range and it must be the last argument in the function).
Here's an example:
For all Excel Add-in functions, avoid the use of special characters (e.g. P&L) or punctuation when naming Data models, Cubes, and Entities. The use of these special characters could effect functions and their results. Refer to naming convention best practices.