Charts are a key feature in Board Foresight to help users analyze and present complex forecasting data in an understandable format. Create your own custom charts by plotting any indicator with one or more other data series.
This article describes:
How to Create a Chart
Navigate to the Charts page.
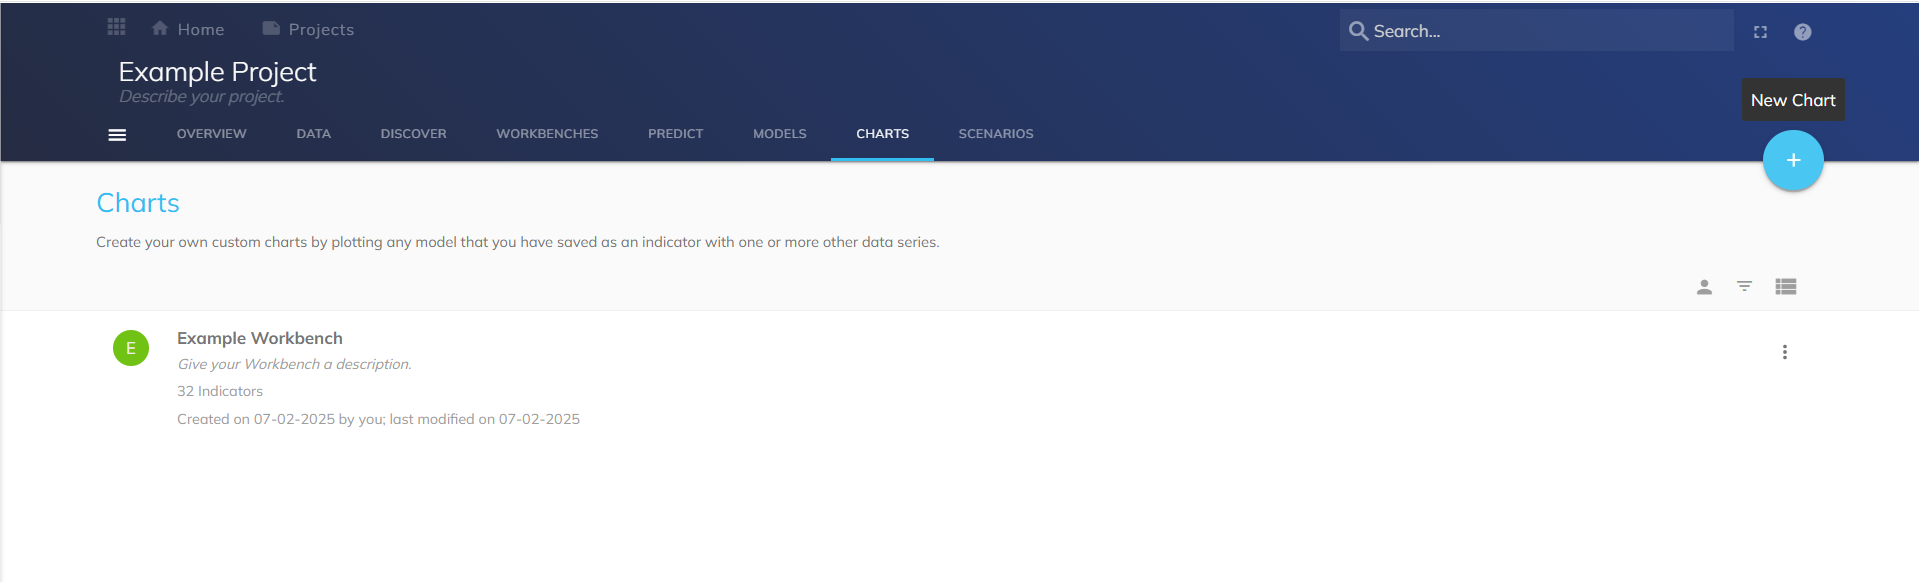
Select New Chart. A modal will appear to enter the name and description of the chart.
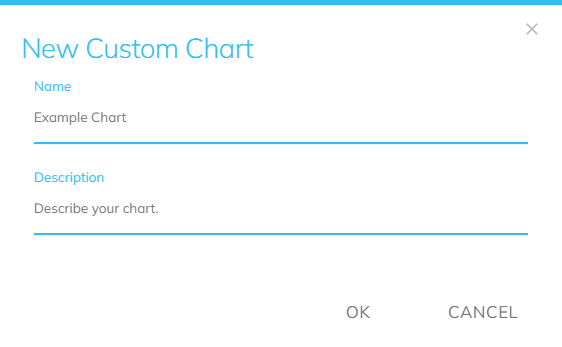
Click OK when finished. You have successfully created a template for a chart.
Adding Indicators to a Chart
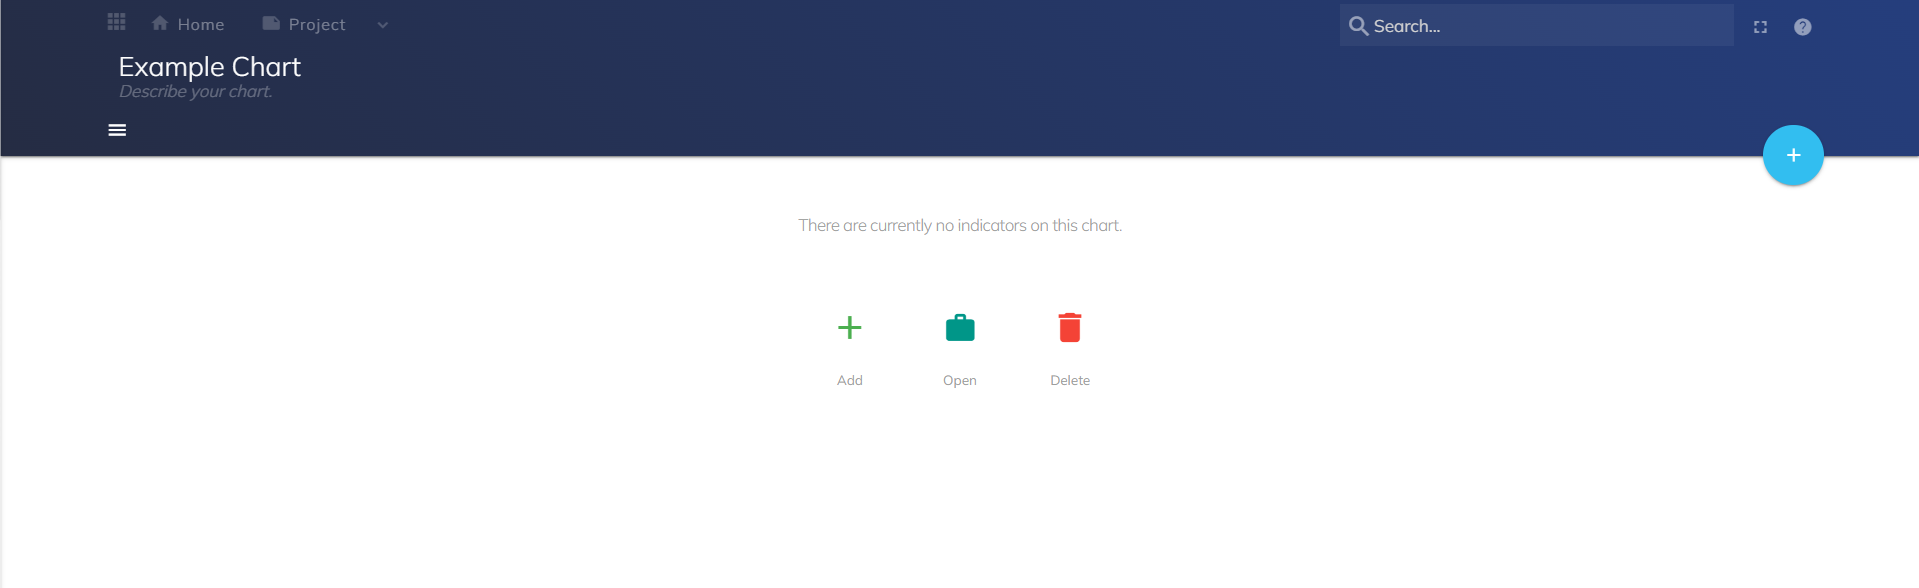
After a Chart has been created, there are three options:
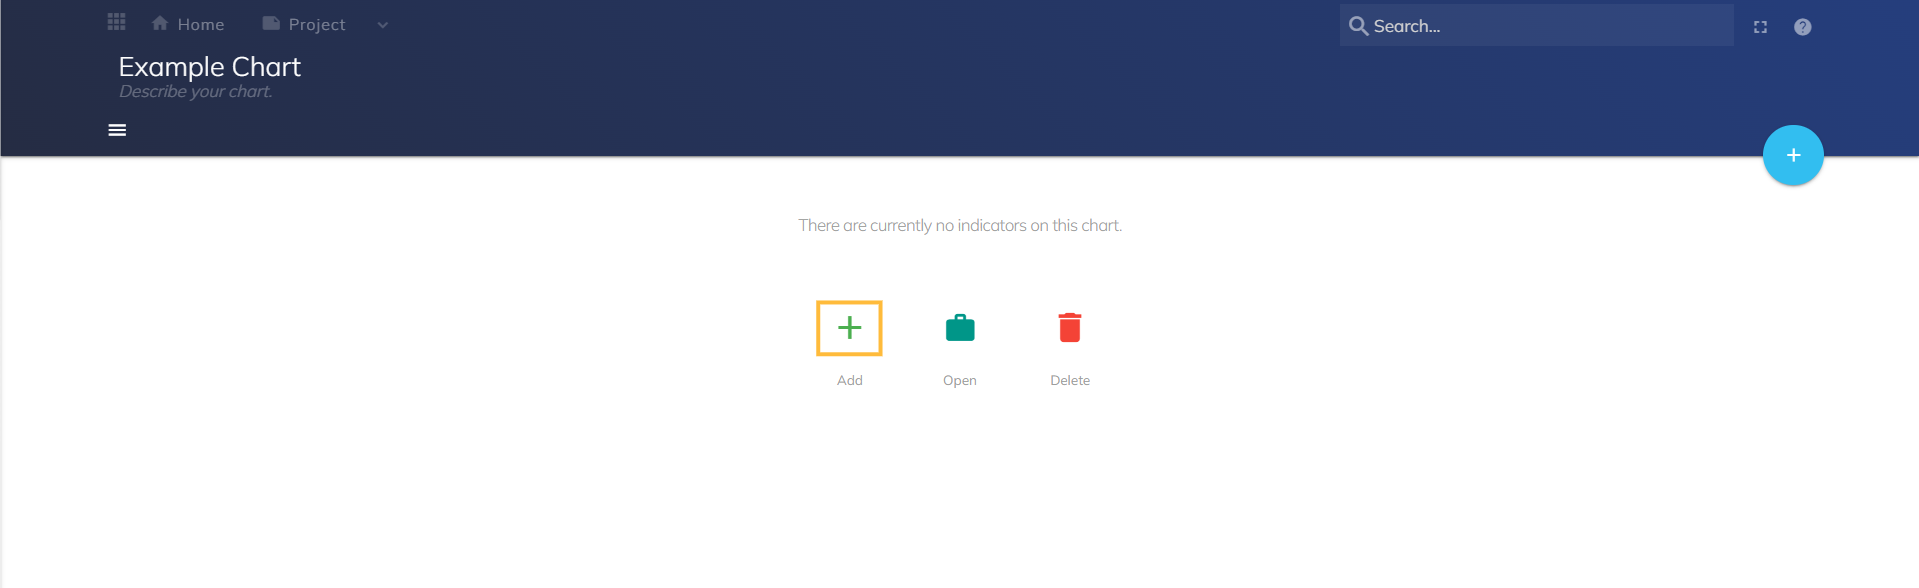
Add: Add an indicator to your chart.
Open: Open indicators from workbench.
Delete: Delete your chart.
Click Add Indicator.
A Select Indicators modal appears. Choose indicators you wish to add to your chart using the Applied Filters, Project, Search, Browse, and Favorites tools. Click OK when finished.
.png)
You have successfully added an indicator to a chart.
.png)
Opening Indicators from a Workbench
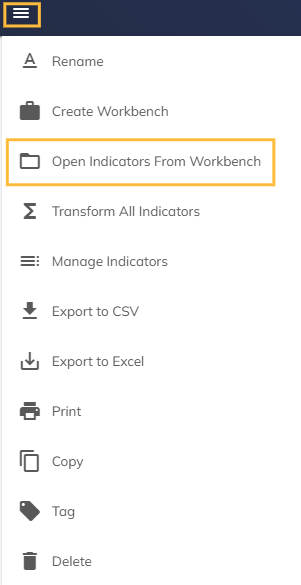
Click the hamburger menu and select Open Indicators From Workbench
A Select Workbench modal appears. Select a Workbench indicator to add to your chart.
.png)
A Select Indicators modal appears. Review the selected indicators and click OK when finished.
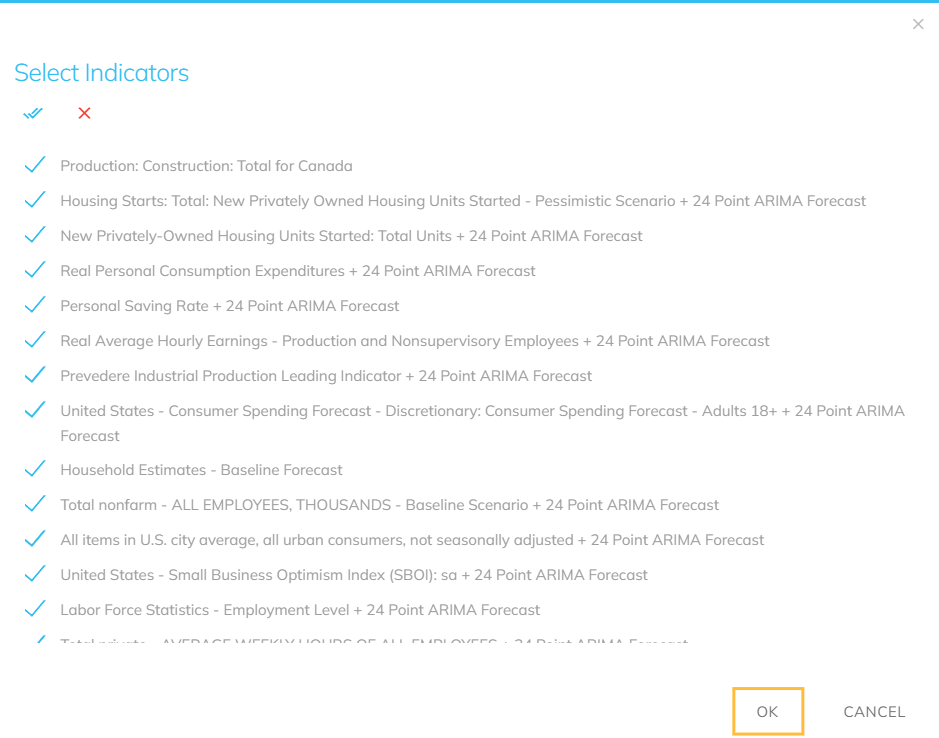
Your Workbench indicator has been added to the chart.
Menu Options on the Chart Page
.png)
Rename: Rename the Chart.
Create Workbench: Create a new workbench from the indicators on the chart. A primary indicator will not be selected.
Open indicators from Workbench: Add indicators from the Workbench to the chart.
Transform All Indicators: Change the calculation of the chart.
Manage Indicators: Toggle the visibility, remove, and reorder the indicators.
Export to CSV: Save the chart to your device.
Export to Excel: Export the chart to Excel.
Print: Print the chart.
Copy: Copy the Chart.
Tag: Add tags to the Chart.
Delete: Delete the chart.
Side Menu
.png)
Indicator: Select the drop down menu to change which indicator of reference for the tool bar. Select the indicator to be taken to the indicator on a new window.
Frequency: Select the time interval for your indicator’s data to view on the chart.
Calculation: Select the transformation of data for the chart.
Offset: Dictate the offset for the chart.
Point Style: Select a point style for the chart.
Line Style: Select a curve style for the chart.
Curve Style : Select a curve style for the chart.
Color: Select a color for your indicator.
Hide: Hide the timeseries from the chart view.
Remove: Delete an indicator from the chart. The chart will automatically display the next indicator.
Transform: Apply transformations to the chart.
Chart Setting Toggles:
Points: Display points on the data series.
Labels: Display labels on the data series.
Horizontal: Display horizontal lines on the chart.
Vertical: Display vertical lines on the chart.