This topic describes how to add a Gantt Object to a Screen or a Container and its specific properties.
To create a Gantt chart, you need to access a Screen in Design Mode.
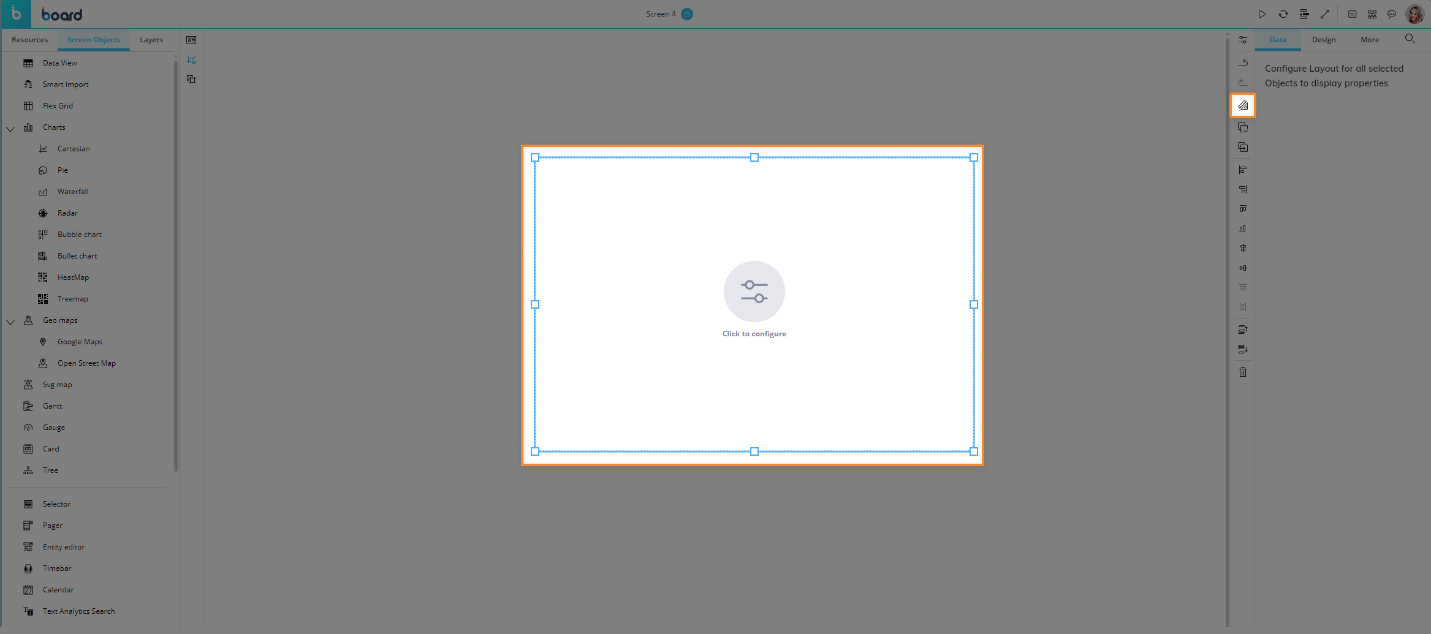
Once you're in the Screen editing page, locate the Gantt Object from the Screen Objects list in the left panel, then drag and drop it onto your Screen or Container.
When you create a Gantt chart, it is initially empty. The next step is to configure a Layout that will define the data to be displayed. To do so, click the center of the Object or select the Gantt Object and click the "Configure layout" button (  ) located in the Properties toolbar located along the Properties panel to the right of the Screen.
See The Layout Object, Configure a Layout, and About Data Blocks of a Layout for more details on the Layout Object.
The Gantt chart, just like every other Object, can be moved, resized, duplicated via copy/paste, and easily aligned with other Objects on the Screen.
See Configure Screen Objects for more details.
Gantt Layout
The Layout editor for the Gantt Object is slightly different from the classic one in that it offers some specific options and properties.
The main differences are highlighted in the image below:
The Data Area
To build a Gantt chart, you must add the following Block to the Layout:
A Date-type Cube containing the start dates of activities.
A Date-type Cube containing the end dates of activities.
Both Cubes must be dimensioned by the Entity added By Row or, in case two Entities are present, by the most-nested Entity added By Row.
You can also add additional Blocks to display more information in the chart, such as:
A Data-type Cube containing values that represent the progress of each activity expressed in days.
A Data/Text-type Cube containing values that represent the dependencies of project activities.
A BLOB-type Cube containing pictures to be displayed at the beginning of each activity bar in the chart.
The Cubes mentioned above must be dimensioned by the Entity added By Row or, in case two Entities are present, by the most-nested Entity added By Row.
Example:
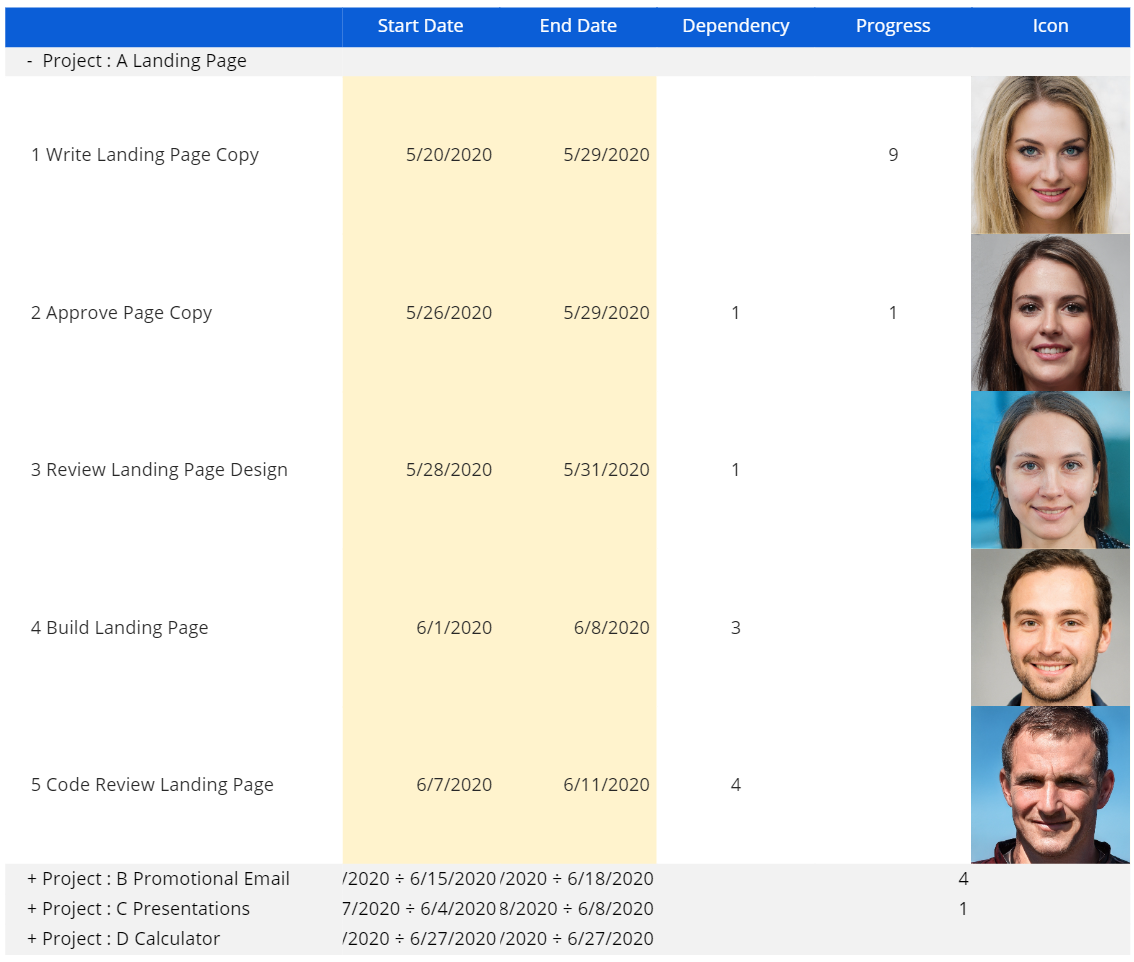
In the following Layout, all Blocks containing various data to be visualized in the chart have the Entity "Task" in their structure:
The following Data View shows all values/data from those Blocks for each member of the Entity "Task".
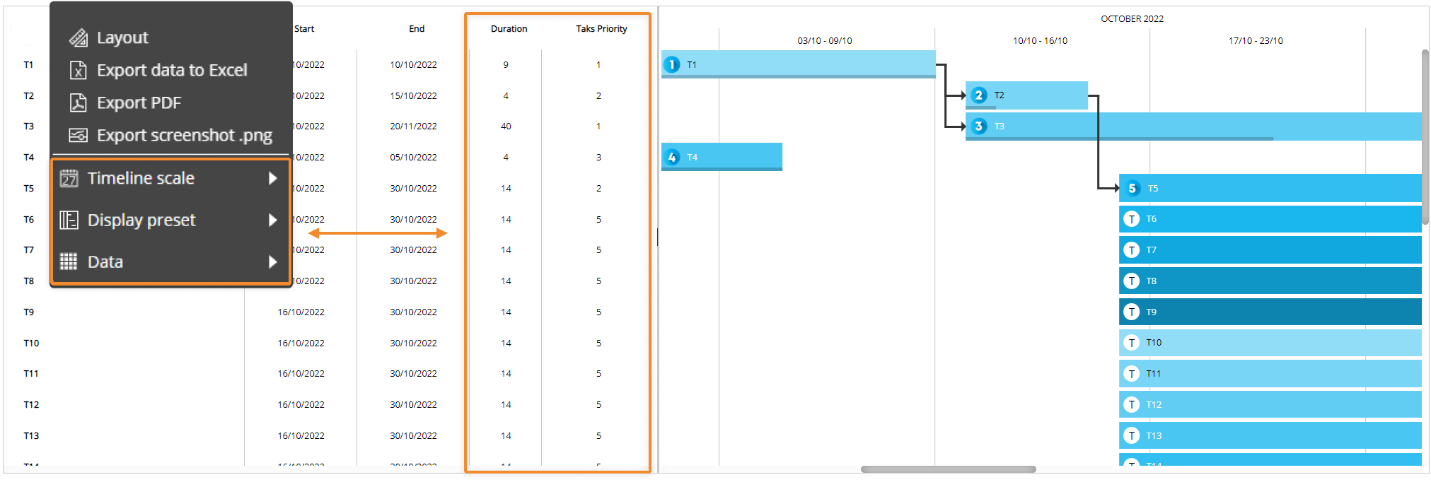
In the case where you configure a Layout with additional Data Blocks, which are displayed in the columns in the left area of the chart, three additional options explained in this page will appear in the Sliding Panel in Play Mode. See Interacting with a Gantt object for more details.
To complete the Gantt Layout configuration, all Gantt chart elements from the Object settings area must be associated with the correct Blocks.
The Axes area
In the Axes area, you can define up to two Entities By Row. Those Entities should be part of the same hierarchy, and their members should be the project stages and single activities/tasks respectively.
At least one Entity By Row is required. The Gantt chart doesn't support Entities By Column. If you add two or more related (i.e. they are part of the same hierarchy) Entities By Row, Board will automatically group them: the most-nested Entity in a Relationship is always arranged in the rightmost position and you won't be able to rearrange their order. The least-nested Entity represents the groups of activities, while the most-nested Entity represents single activities.
Object settings
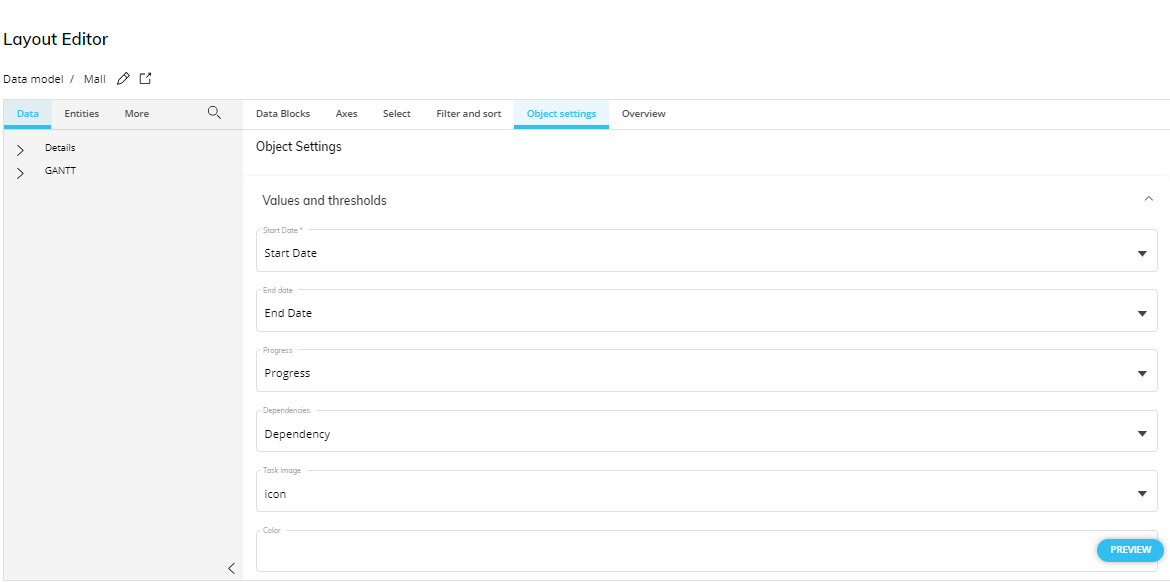
In the Layout editor, in the Object settings area, a few dropdown menus allow you to define which Blocks will be used for displaying data in the Gantt chart.
They are the following:
Start date (required). Defines the Date Cube containing the start dates of activities.
End date (required). Defines the Date Cube containing the end dates of activities.
Progress (optional). Defines the Cube containing values that represent the progress of each activity. If no Block is selected, no progress bar will be displayed on activity bars.
Dependencies (optional). Defines the Cube containing values that represent the dependencies of project activities. If no Block is selected, no arrow showing dependencies will appear in the chart.
Task image (optional). Defines the BLOB Cube containing pictures to be displayed at the beginning of each activity bar in the chart. If no Block is selected, the first letter of each task will be displayed instead.
Colors (optional). Define a Block that will be used as a driver for the color of all activity bars in the chart. If no Block is selected, the palette configured in the Object Properties panel to the right of the Screen editing page will be used.
Gantt properties and settings
Gantt properties are available from the Object Properties panel of the Screen editing page once the Object is selected and it's associated with a Layout.
The Gantt chart Object supports all options common to all Screen Objects and the following two properties:
Master Object. If enabled, clicking on an activity will update the data displayed by all other Objects on the Screen in order to show only the data relating to that specific activity. The Master Object result is similar to applying a Screen Selection.
Disable Drill down. Disables the drill-down functionality, both in Design Mode and Play Mode.
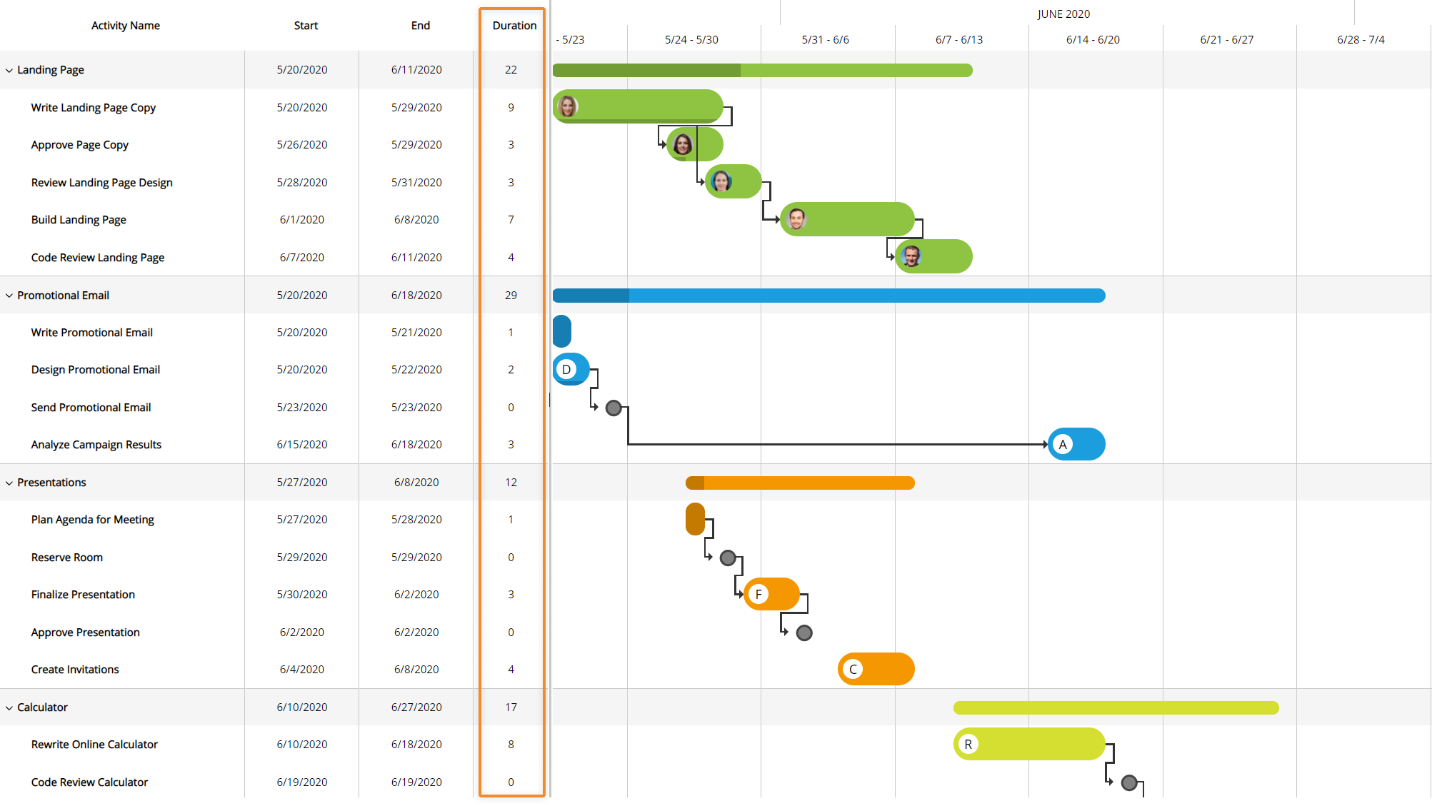
Gantt-specific properties are highlighted in the following image and explained below:
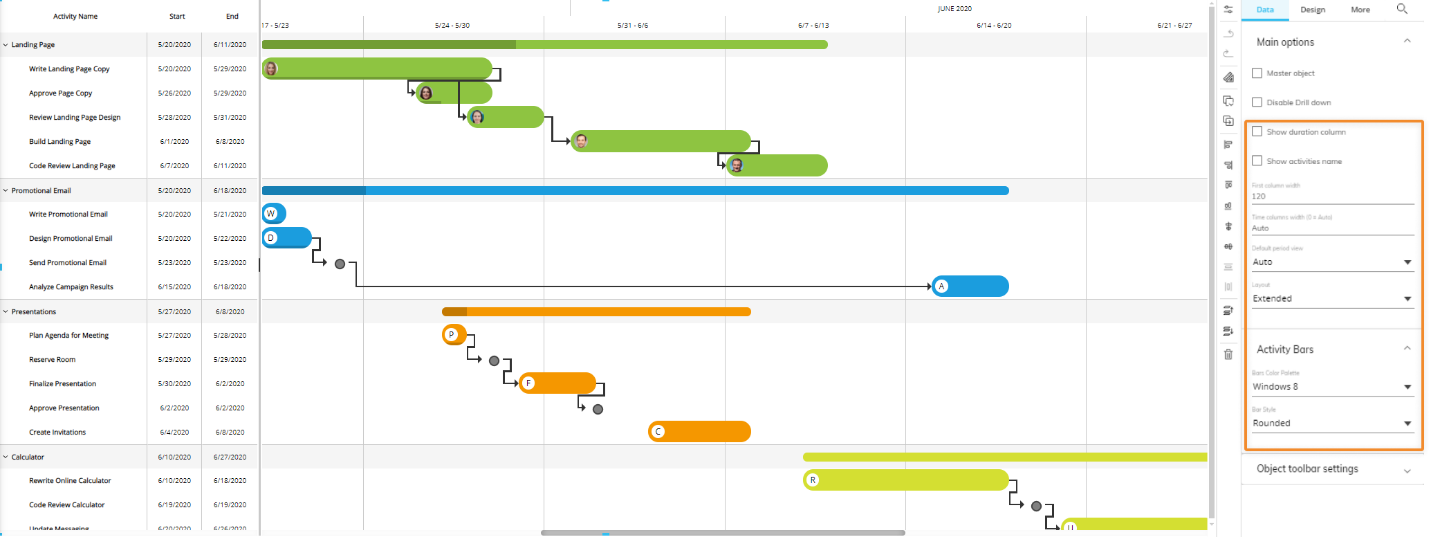
Show duration column. Shows/hides the "Duration" column in the left area of the chart. Since this option adds a Column, three additional options will appear in the Sliding Panel in Play Mode. See Interacting with a Gantt object for more details.
Show activities name. Shows/hides the activities name within activity bars.
First column width. Defines the width of the "Activity name" column.
Time columns width. Defines the width of time scale columns. Set "0" to have Board automatically select the best setting for this option.
Default period view. Defines the time period used to group time scale columns. Set "Auto" to have Board automatically select the best setting for this option.
Layout. Allows you to define the height of activity bars, compact or extended.
Activity Bars
Under the "Activity bars options" menu, you can define a default color palette that will be used if no Block has been configured in the Object settings of the Layout. You can also define a style for the corners of the bars: rounded or square.
Interacting with the Gantt Object in Design Mode
In Design Mode, the Gantt Object provides the same interactive features available in Play Mode, with a few notable differences regarding Drill functions.
You can also configure which options will be available in the Object toolbar in Play Mode. To do so, double-click or Ctrl + click the Object and click the Object toolbar icon (  ) in the top left corner, then expand it by clicking on the 3 vertical dots (
  ). The configuration panel is accessible from the cog icon in the top right corner.

Default Drill Down
You can configure a default drill down path saved in the map configuration that will deploy when end users select a bubble and click on the Drill down button in Play Mode.
Map areas don't support drill features.
To configure the default drill:
Select a bubble and click the Drill Anywhere icon (
 ).
).From the popup window, select the Entity to drill down on and click "APPLY". The configured drill is performed and data is displayed in a Data View.
Close the Drill down window and save the Screen. The configured Drill is now the default, in both Design Mode and Play Mode.
End users will still be able to configure other drill down paths in Play Mode, if they're allowed to do so. See the next paragraph for more details.
Screen selections and selections made by the user using Selector Objects (if any) also apply to data in drill down windows.
Limit Drill down Entities
You can limit drill down paths that end users are allowed to configure by selecting the Entities the user can drill down on.
To do so, while in Design mode, click "CONFIGURE" in the top right corner of the Drill anywhere window to enter the Drill Anywhere configuration window. From here, under the Entities tab, select/unselect the Entities that you want to show/limit to the Planners. The selected Entities will be the only ones available to the Planners during the Drill Anywhere configuration in Play Mode.
Drill-to-Screen
To allow users to drill-down from the map to another Screen within the same Capsule with a selection on the selected bubble element, proceed as follows:
Select a bubble and click the Drill Anywhere icon (
).From the popup window, click the "CONFIGURE" button in the top right corner of the window to enter the "Drill Anywhere configuration" window, and click on the "Screen" subpage. Enable the toggle next to the Screen subpage title and select all the Screens you would like to allow the Planners to drill to.
These Screens will be the only ones available when conducting a Drill-to-Screen from the Object in Design and Play Modes, however, in Design Mode, you can see any hidden Screens from the Drill Anywhere window when you enable the "Show hidden" toggle in the top right corner of the window (which also shows you the hidden drills.
Click "APPLY" to close the configuration window.
From the Drill Anywhere window, you can now further configure your Drill-to-Screen with the following options:
Select the "Same tab" checkbox to open the destination Screen in the same browser tab.
Select the "New tab" checkbox to open in a new tab.
The Drill to Screen mode, if enabled, will open the destination Screen with a selection on the row header (a member of the Entity set By Row) when the user double-clicks on it or selects it and clicks on the Drill-down icon (
 ).
).The Go to Screen mode, if enabled, will open the destination Screen when the user double-clicks on a row header (a member of the Entity set By Row) or selects it and clicks on the Drill-down icon (
). The destination Screen does not inherit any selection from the Data View.The Dynamic Screen option allow to select a Block (an Algorithm) to dynamically change the Screen navigation based on another Block values (a text cube containing Screen names).
Click "APPLY" to save the configuration.
This feature allows you to nest your analysis in a more powerful way than the standard drill down, which only changes the level of granularity of a report. In a Drill-to-Screen navigation the data represented (values, indexes) and types of Objects (Charts, Dashboards, Data Views) may vary as the user drills from a top level view to another Screen at a more detailed level.
Screen selections and selections made by the user using Selector Objects (if any) also apply to data in the target Screen.
Drill-Procedure
It is possible to trigger a Procedure from a map when the user selects a bubble and clicks on the Drill down icon. The Procedure is launched with a selection filter applied based on the clicked bubble.
If a Drill-Procedure containing two or more procedures is configured, when the user double-clicks on a bubble, a popup window allows the user to select the Procedure to run from a configured list.
To configure a Drill-Procedure:
Select a bubble and click the Drill Anywhere icon (
).From the popup window, click "CONFIGURE" in the top right corner of the window to open the Drill Anywhere configuration window and select the Procedures tab.
Select the Procedures for the drill configuration. Choose whether the Procedure comes from the "Capsule" or the "Data Model" and then select the Procedure from the dropdown menu (as described below).
Capsule. If selected, the dropdown menu to the right allows you to choose from a list of Procedures saved at the Capsule level.
Data model. If selected, select a Data Model from the dropdown menu on the right. By doing so, only Procedures belonging to the chosen Data Model will display in the dropdown menu to the right.
After you've chosen the desired Procedure, click the "ADD" button on the right. Repeat the process for each Procedure you want to add to the drill.
Enable Procedures with the corresponding toggle by the tab header to allow end users to configure a Drill-Procedure with the Procedures that you just added.
If the Procedure toggle is left disabled, its configuration will not be available in Play Mode.
Click "APPLY" to save the Drill-Procedure configuration and return to the Drill Anywhere window.
Double-click a Procedure or select one and click "APPLY".
Screen selections and selections made by the user using Selector Objects (if any) also apply to data in drill down windows.
Drill Through
It is possible to execute a Drill Through from a map when the user selects a bubble and clicks on the Drill down icon. The Drill Through is executed with a selection filter applied based on the clicked bubble.
Drill Throughs are configured in the Drill Through section of the Data Model.
To configure a Drill through on bubbles:
Select a bubble and click the Drill Anywhere icon (
).Click on the Drill through tab to view.
If the Drill through feature is enabled from the "Drill Anywhere configuration" window, a "Drill Through" tab will be visible.
If the Drill through feature is enabled and you would like to configure a Drill Through on a row header that is not part of the list you configured as available to the Planners, you can do so by enabling the toggle "Show hidden" and selecting a hidden Drill Through.
If the Drill Through feature is disabled, you can still apply a default Drill Through by enabling the "Show hidden" toggle in the top right corner of the window and selecting a Drill Through.
Double-click the Drill Through or select one and click "APPLY" to save the Drill Through default configuration.
You can also double click on the Drill Through which will save the configuration and close the window (and you can skip the 4th step).
To configure which Drill Throughs the Planners can use and see in Play Mode:
Select a data point and click the Drill Anywhere icon, or you can double click on a data point if a default Drill has not already been configured.
From the popup window, click the "CONFIGURE" button to open the "Drill anywhere configuration" window.
Select the "Drill Through" tab. Enable the toggle next to it and add the desired Drill Throughs you'd like to be available to the Planners below. If the toggle is not enabled, the Drill Through drill down will not be available within the Drill Anywhere window (when accessed by the contextual menu) for Developers or Planners.
Click "APPLY" to save and return back to the Drill Anywhere window where you can now configure a default Drill Through.
Click "APPLY" to save the Drill Through configuration.
Screen selections and selections made by the user using Selector Objects (if any) also apply to data in drill down windows.