The Gauge Object provides the following interactive features:
Any changes made to a Gauge Object using the functions listed above will be lost if you leave the Screen or update it, except for Data Entry actions.
Details popover
When you hover over a secondary value label or a marker, a Block details popover will appear. The popover will display relevant information related to the associated Block, such as its total value and its heading.
Drill Anywhere
The Drill Anywhere feature allows you to configure a default Drill Down for the Gauge Object.
To configure it, proceed as follows:
Double-click on the Gauge area or select it and click the Drill Anywhere icon (
 ) in the sliding toolbar.
The Entity list you are allowed to drill down on will appear in the drill configuration window.
Select the desired Entity and click "APPLY" or double click the Entity to save the Drill and to perform it. The configured drill data is always displayed in a Data View.
Once the drill is saved, it can be easily performed again on other bubbles by clicking on the Drill Down icon (  ).
).
The Drill Anywhere function is available also in the drill-down windows, so you can create your own drill-down paths at different levels of granularity. Learn more about drilling down in a Data View Object.
Drill down
Once you have configured a drill using the Drill Anywhere feature, double click on the Gauge area or select it and click the Drill Down icon (  ) to perform it again.
Data Entry (in drill-down windows)
Although the Gauge Object doesn't allow it directly, you can perform Data Entry actions in Data Views displayed in drill-down windows.
See Data Entry on Cubes and Data Block settings for more details.
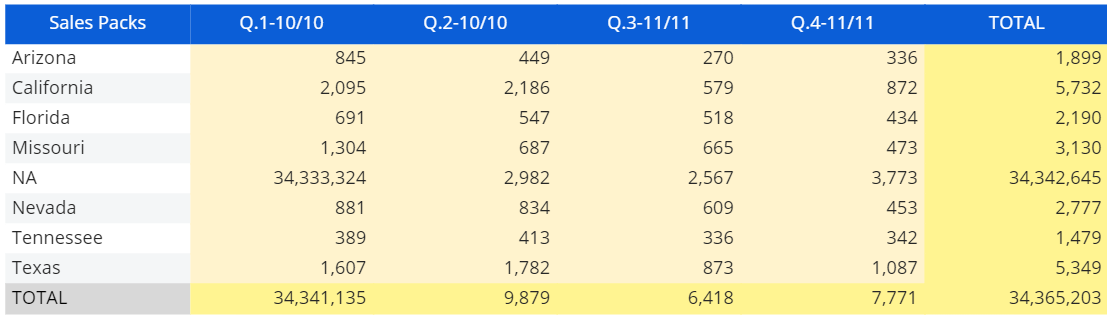
When Data Entry is enabled on a Cube, the background of the totals cells turns yellow, while the background of the values cells turns beige (unless otherwise formatted), as in the following example:
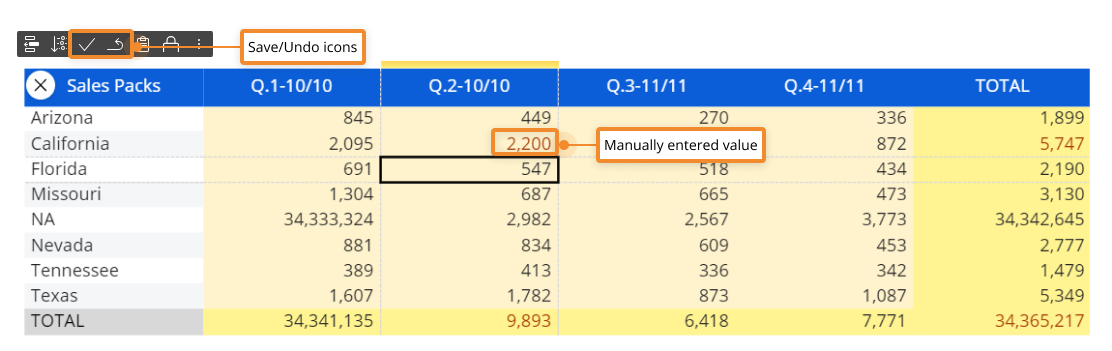
To perform a Data Entry action, double-click on a cell to enter data (either by typing a value, by uploading a file or a picture, by picking a date from a date picker, and so on).
If Save/Undo mode is enabled on the Screen, after you have entered a value, click the save icon  at the top left of the Data View to actually save the value in the Cube. To do this, you can also press the F9 key on your keyboard.
The undo arrow icon allows to restore the last saved values (i.e. it discards all unsaved changes).
Unsaved values and totals that depend on those values are shown in red. When you click the save icon, their text color will change to match the text color of previously saved values, indicating that all changes have been saved in the target Cube.
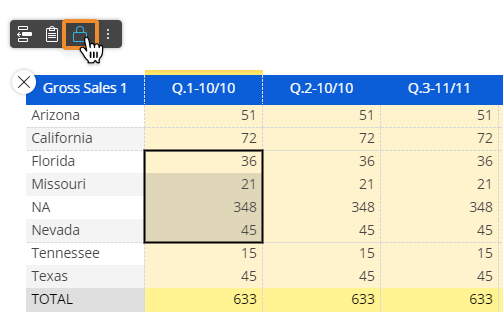
When the Data Entry option is enabled in the Layout, after you have manually entered data in a cell, the contextual menu (sliding toolbar) in the top left corner of the Data View will automatically show the Save/Undo icons (if Save/Undo mode is enabled on the Screen) and the Lock/Unlock icons (see Lock and Spread for more details).
The Object toolbar
When you hover over a Gauge Object, the Object toolbar icon (  ) appears in the top left corner. Click on it to reveal the Object toolbar as a sliding toolbar. You can fully expand it by clicking on the 3 vertical dots on the right.
The Object toolbar includes the following icons by default (unless otherwise configured):
The Layout icon
 . Opens the Layout editor.
XLSX icon
 . Exports data in a MS Excel Worksheet as a flattened table.
Export printable report to PDF
 . Export the chart as as a PDF file.
Export screenshot to .png
 . Takes a screenshot of the chart and saves it as a .png file.
Comment icon
 . Displays any comment attached to the chart (if any). Depending on the comment configuration, the icon displayed can be a balloon icon, a question mark icon or an alert icon.