The Pie chart shares most of its options and properties with the Cartesian chart, with a few exceptions described in the following paragraphs.
Under the Pie Main options menu you can customize a few format options for the chart. They are the following:
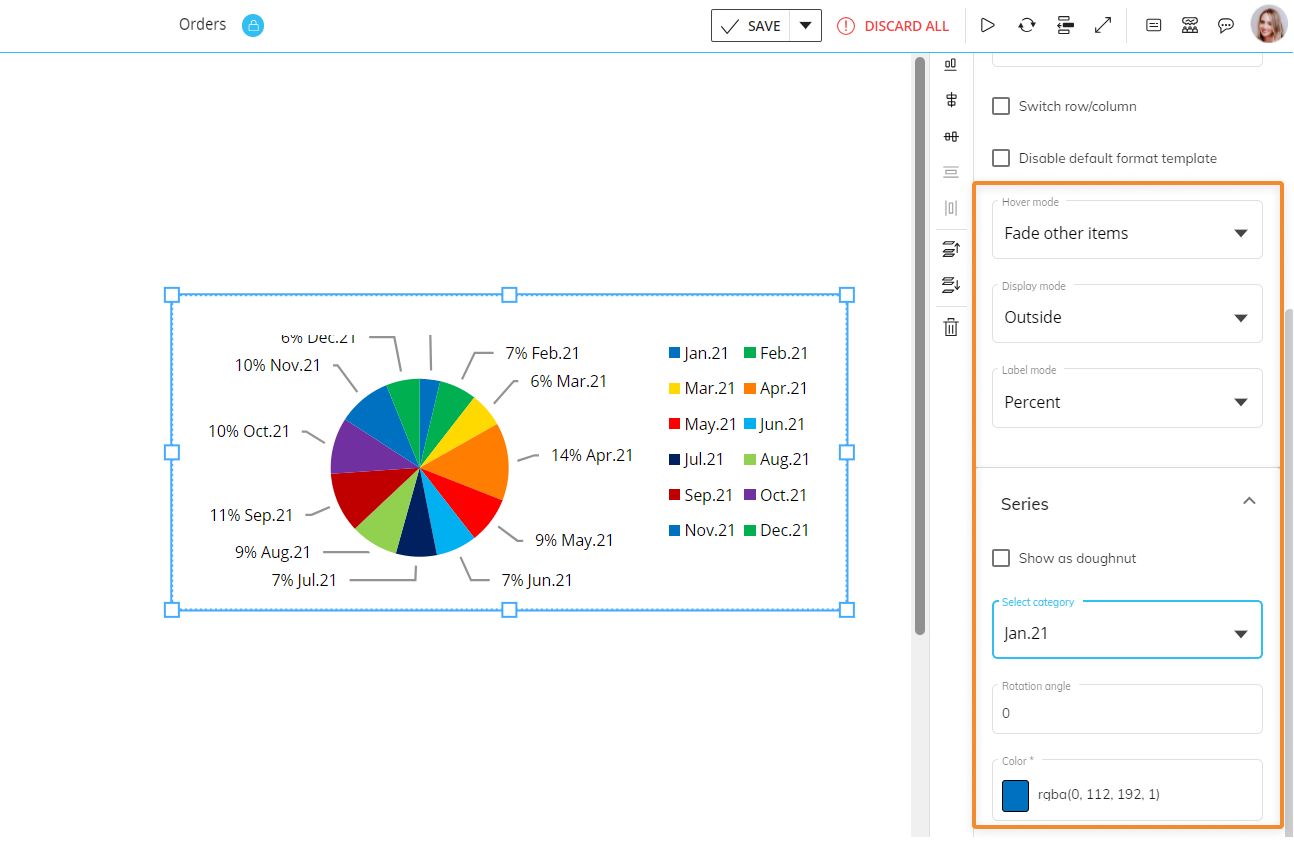
Hover mode. If you select "Fade other items", when you hover over a slice (category) or a data label all other slices and data labels will appear opaque.
Display mode. Defines data labels visibility and position (inside or outside the pie area).
Label mode. Defines the information displayed in data labels.
Under the Series menu, the following options are available:
Show as doughnut. Enable this option to turn the pie chart into a doughnut chart (i.e. a pie chart with a blank circular area in the center).
Select category. Select the category whose color you want to change in the "Color" option below.
Rotation angle. Defines the rotation angle of data labels.
Color. Applies the selected color to the selected category (slice of the chart).