This topic covers how to open a Board Microsoft Layout, its common settings and configurations, and Block settings. The Layout is very similar in all Microsoft Add-in applications and this article describes the common options and settings of a Layout, which are as follows:
To find out more about the specific Layout Options and settings, see:
Open a Layout with Board Add-in
To open a Layout in Board Microsoft Add-in, click on the relevant button to be able to open the Layout:
Excel Add-in. Layout button:

Word Add-in. Board Toolbox buttons:
Chart, Cockpit, BubbleChart, Heatmap, and Treemap buttons open the Component Designer window where you must right click inside the editing area to reveal the right-click menu and select "Layout" to open the Layout Editor. Read more about it in Create an Object with Board Word Add-in.
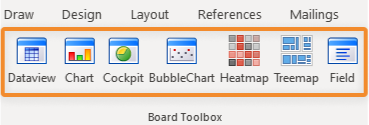
PowerPoint Add-in. Board Toolbox buttons:
Chart, Cockpit, BubbleChart, Heatmap, and Treemap buttons open the Component Designer window where you must right click inside the editing area to reveal the right-click menu and select "Layout" to open the Layout Editor. Read more about it in Create a Data View with Board PowerPoint Add-in.
The Add-in Layout Editor general options
The Board Microsoft Add-in Layout Editor has similar functions and follows the same rules, restrictions, and logic as the Board Platform Layout Editor, although it looks a little different.
In the Layout Editor, the general options displayed are:
Layout Title. Name the Layout.
Database. Choose the Data Model you would like to use to create your Layout. Once the first Layout has been created, the Data model chosen for that first Layout will remain selected so as to avoid reselecting it every time.
Layout Performance. This section gives you information about your Layout configuration, Block size, Cube dimensions, and Cube details like the data type and the file name, the overall performance, if it needs any revisions, and if it has any issues.
Copy Layout. Copies the configuration of the current Layout.
Paste Layout. Pastes a Layout configuration that was recently copied.
Clear Layout. Clears the Layout to start again.
OK. Saves changes to and exits the Layout and refreshes the Object to automatically display what was configured.
Cancel. Cancels any unsaved changes and exits the Layout.
Apply. Saves changes to and exits the Layout without refreshing the Object so as not to instantly display what was configured in the Layout. To display what was configured in the Layout after pressing "Apply", you must press the "Refresh Sheet" button in the top menu of Excel.
The main sections available for configuration in the Layout are:
Data. Add or create Data blocks of Cubes, algorithms, Entities, ranking functions, or Rules.
Axes. Add Entities by Row or by Column to configure the Layout.
Filters. Add filters to each Data Block.
Options. Options are specific to each type of Object.
Select. Add a selection to the Layout.
To know more about the rules, restrictions, logic, and behavior of the Layout Editor, see About the Layout Object, Configure a Layout, About Data Blocks of a Layout, and About Data Block settings.
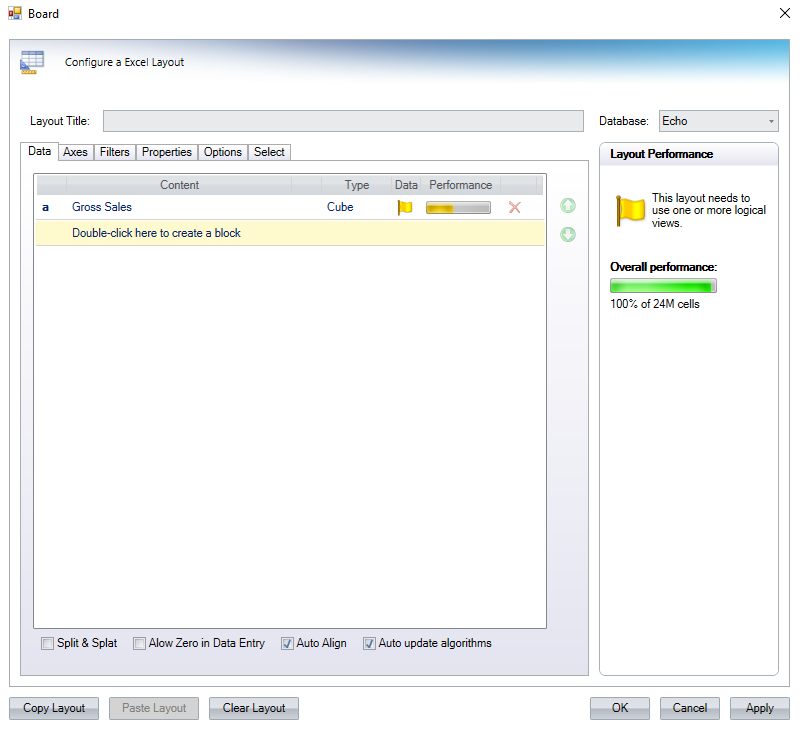
Data area of the Layout Editor
Within the Data tab, you will find the Data area where you can create Data Blocks for your layout. The Data area has 4 columns which are:
Content. Displays the name of the Data Block.
Type. Displays the type of Block: a Cube, Algorithm, Entity, ranking function, or Rule.
Data. Displays a colored flag that represents the status (also written out in the Layout Performance column) of the Data Block. When you hover over it, the tooltip displays the Cube's dimensions.
Performance. Displays a bar to indicate the performance of the Data Block. Low performance will appear red, middle performance will appear yellow, and optimal performance will appear green.
At the bottom of the Data area are 4 options that, upon enabling, apply to all the Blocks. The 4 options are:
Split & Splat. Allows the relative redistribution of data based on Data Entry. Read more about Split & Splat.
Allow Zero in Data Entry. Allows users to enter a value of 0. By default, 0 is not a valid data entry because the value 0 and an empty cell are not differentiated; if this feature is enabled, users can enter 0 as a data entry value.
Auto Align. Aligns Data Entry performed on Cube in all of its versions and is active by default.
This setting is no longer supported in the web version.
Auto update algorithms. When an algorithm Block includes another Block in its algorithm and that Block changes position, the algorithm will automatically change in order to accommodate the position change. This setting is enabled by default. When a Block that is part of the algorithm is deleted, the algorithm does not change. For example, If Block a is Budget and Block b is Forecast and Block c is the algorithm a-b, if Block b is changed to position a, the algorithm automatically changes to b-a.
Data Block settings
You can create a Data Block by double clicking on the yellow-highlighted text that says "Double-click here to create a block" which will open another window with all the settings to configure your Data Block.
The Block settings consists of the following areas:
Block Heading
Give the Block a unique descriptive title.
Setup
Configure the basic setup of the Block that you are adding to the Layout:
Type of Block:
Data Selection. Select a Cube from the dropdown that corresponds with the Data model chosen for the Layout.
Column Algorithm. Write an algorithm and choose the type of algorithm: Numeric, Text, Date, Picture.
Entities & Relationships. Choose an Entity from the dropdown that corresponds with the Data model chosen for the Layout.
Ranking Function. Choose a ranking function option from the dropdown: Vertical %, Cumulated Vertical %, Counter, Cumulated Counter %, Cumulate Value, or 85-95 Ranking.
Rule. Choose a Rule from the dropdown of which are Rules made within the Data Model chosen for the Layout.
Dec Digits. Sets the number of decimal digits to display, this option only applies to numeric values.
Divide By. Divides values by the specified number.
Summary Algorithm. Defines the method for calculating row and column totals. To learn about these options, read more here.
Row Totals. Divides values by the specified number. This option can be used to display values in thousands or millions.
Setup Options:
Hide Zeros. When enabled, cells that contain no value are displayed as blank. If disabled, cells that contain no value are displayed as zeros (0).
Hide this block. When enabled, it hides the corresponding Block.
Enable Data Entry. Enables Data Entry. See Data Entry on a Data Block.
Reverse algorithm. Allows you to enter a value on a calculated Block (algorithm) in order to recalculate one of the factors of the formula and write it on the corresponding Block.
Pattern based allocation. Allows you to enter numeric data at any aggregation level and automatically have Board allocate it down to the underlying cells of the selected Cube based on a . Read more about pattern-based allocation here.
Previous Year. Select to use the previous year values of the Driver Cube during the pattern-based allocation. This option is only available when Data Entry and pattern-based allocation are enabled.
Functions
Define function settings like Time Functions, Rules, locked by, and Tooltip configurations.
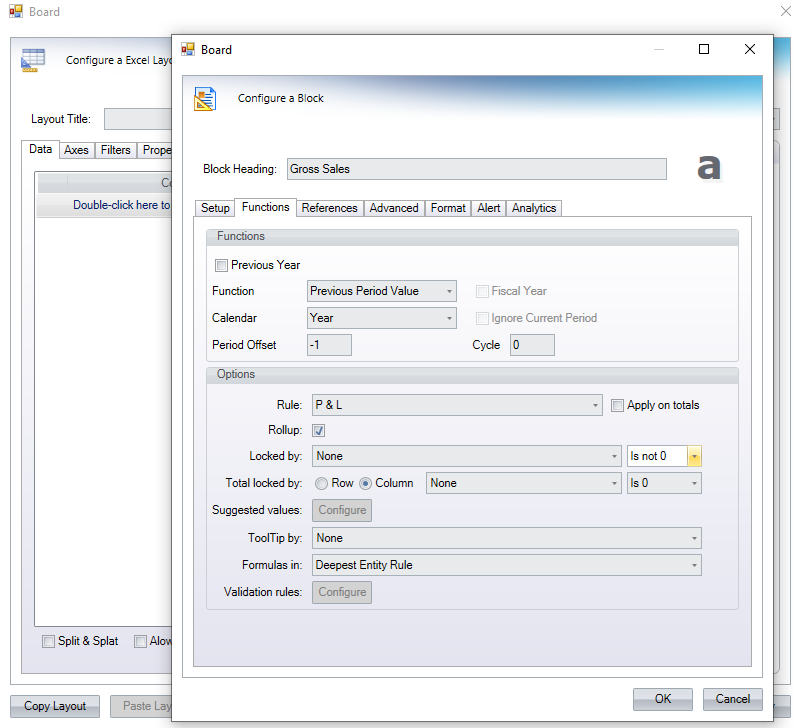
Functions. Configure time functions on a Block. Read more about Time Functions.
Previous Year. When the checkbox is ticked and no other function or option is active, it returns the previous year's data for the currently selected periods.
Function. Select the applicable Time Function from the dropdown menu. Read about the different types here.
Fiscal Year. Obtains the cumulated value from the first period of the currently selected fiscal year. This option is only effective on the Yearly Cumulated Value function and if the fiscal year has been configured in the "Time Range" section of the Board Data Model in use.
Calendar. Custom Time Entities, if created, will show up in this dropdown menu. The Previous Year and Yearly Cumulative Value can be executed on the selected Custom Time Entity calendar if the configuration allows it.
Ignore Current Period. Excludes the last period of the current time selection from the data set used to calculate the statistical functions. Only available with a Time Series function, Trend or Forecast.
Period Offset. The data displayed is shifted by the specified number of periods, for which the period depends on the Cube structure. For example, by setting Period offset to "-3" on a Cube structured by month, the data displayed shifts 3 months backward (e.g. June 2023 column shows the March 2023 data).
The "Period offset" option cannot be used in conjunction with the "Previous year" option.
Cycle. Defines the time range period for the following cumulative functions:
Yearly Cumulated Value
Yearly Moving Total
Yearly Moving Average
By default, the cycle is 12 (i.e. 1 year).
Function Options.
Rule. Applies a Rule chosen from the dropdown to the Data Block.
Apply on totals. Applies the Rule on totals, additionally.
Rollup. Enables the automatic roll-up of Entities on the Data Block.
Locked by. Allows locking Data Entry on cells based on values that are or are not 0 from another Block.
Total locked by. Applies the conditional locking either on Row totals or on Column totals of a single Block.
Suggested values. Allows configuration of suggested values that will be shown to the user during Data Entry actions.
ToolTip by. Displays information based on the content of another Block of the Layout.
Formulas in. Performs calculations, returns information, manipulates cell content, tests conditions, and more. Choose between Single Rule or Deepest Entity Rule. Read more about "Formulas in" in the Nexel section.
Validation rules. Allows you to define a validation formula in order to automatically accept or reject entered values.
References
Set up reference rules like Detail by, Total by, Refer to, and more.
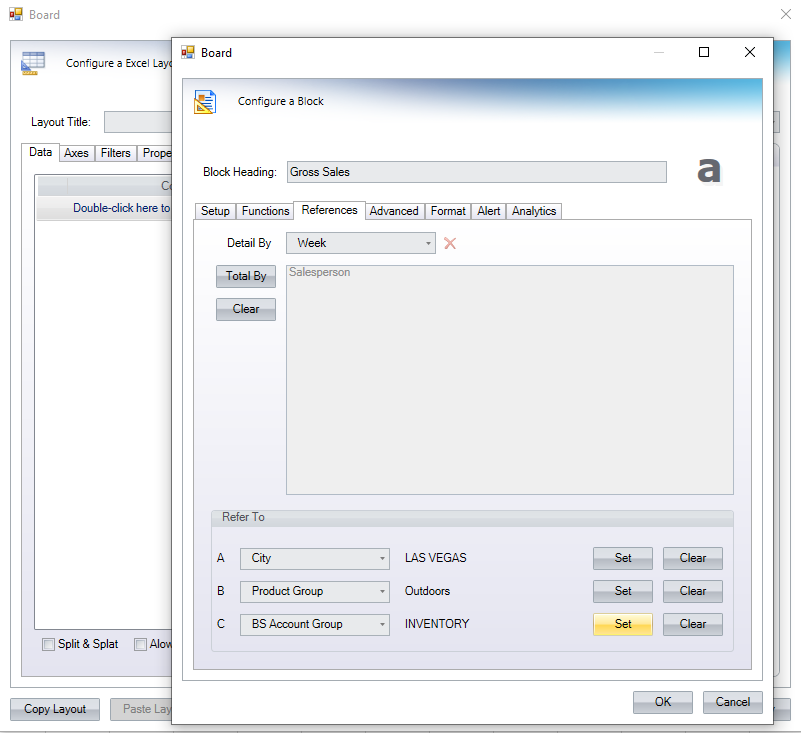
Detail By. Allows you to select an Entity from the dropdown by which to display data for that Block.
Total By. Allows a Cube to be aggregated at a different level than the Entities in the Axis area. Read more about Total by. Click on the button and select all the Entities that apply, and then click "OK".
Clear. Clears all the Entities chosen from the Total By function.
Refer To. Choose an Entity to Refer to. There is a limit of 3 total "Refer to"s per Layout.
Set. Click to apply the Refer to function.
Clear. Click to clear the Entity chosen for the Refer to function.
Advanced
The advanced settings are available to customize the Block even further.
Locked by Cube. Allows you to lock or unlock Data Entry on physical cells of a specific Cube based on values from another Cube and to show or hide locked cells.
Cube. Choose the Cube associated with the Data Model of the Layout from the dropdown.
Display. Allows you to display only values of Data Entry portion cells or values of both free and locked cells with "Total": if you select the "Data Entry Portion" option, aggregated views will only consider cells that are not locked at the physical level of the Cube.
Locker Mode. Choose to lock the Cube cell by selecting "Locked" or not by selecting "Free" and by defining the "Locker Value" below.
Locker Value. Define the value, either "is 0" or "is not 0", in which the Cube cell should be locked or free.
The Aggregation functions are not supported in the Layout.
Format
Customize the Block's formatting. To proceed, you must tick the "Enable custom block formatting" checkbox at the top of the Format area.
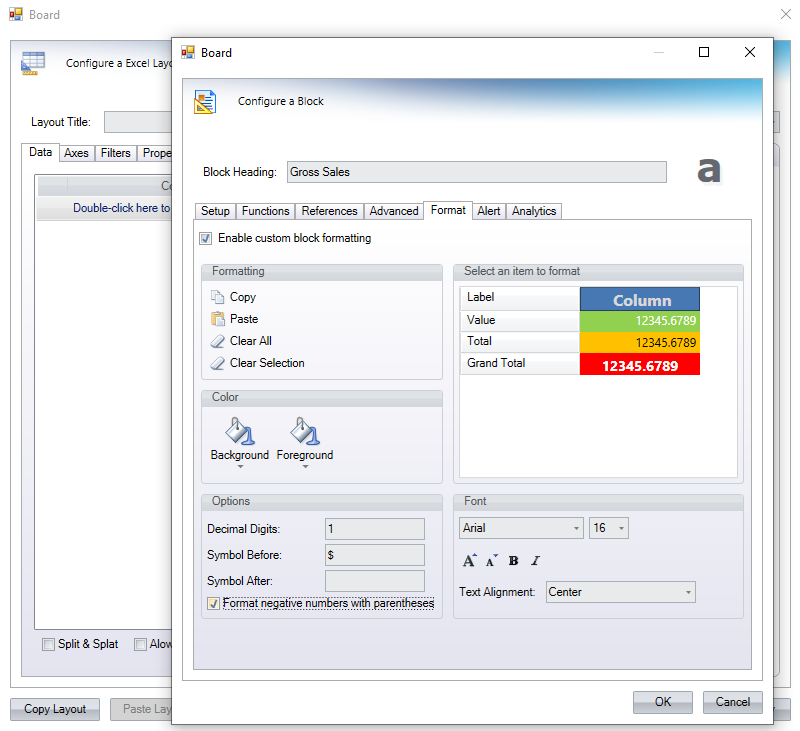
Formatting. Basic controls for formatting: copy the format to paste it in another Block, paste a previously copied format, clear all formatting, or clear a selection of formatting.
Select an item to format. Select the number under the "Column" field next to the item you wish to format. Then set the format using color, font, or other options. Select each item separately. You cannot select multiple items at once.
Color. Choose the color for background and foreground from the Theme colors and Standard colors provided. At the bottom of the color menu, you can add transparency, reset to default, or click more options to select more colors or configure a gradient effect.
Options. Configure other formatting options like the decimal length, putting a symbol before or after each value, or formatting negative numbers with parentheses.
Font. Choose a custom font, size, bold, italic, and text alignment.
Alert
Format values to appear in different colors. Choose each color by accessing the dropdown menu next to each paint bucket icon according to the rules you set whether a value is great than, less than or equal to.
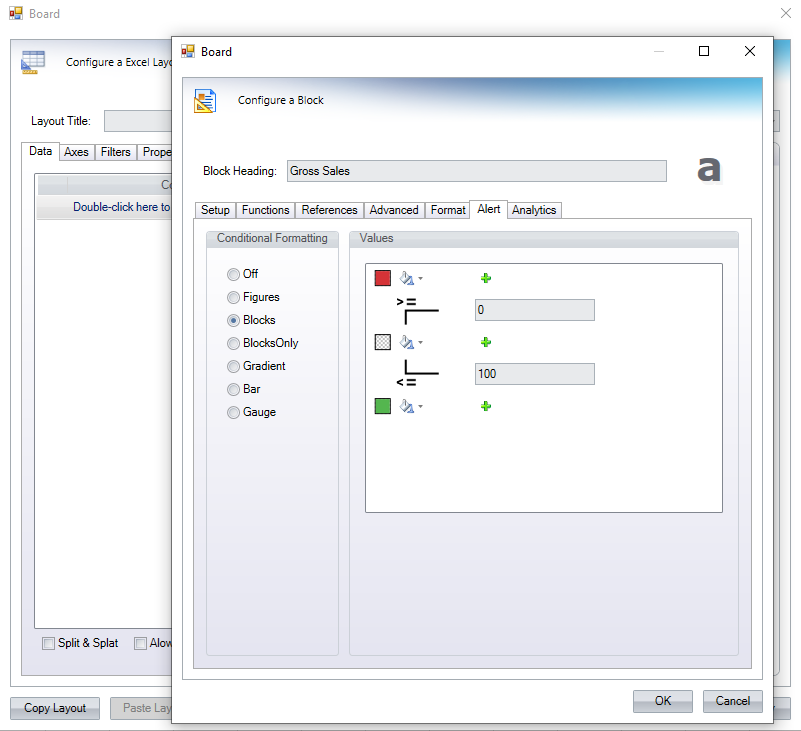
The following styles are available:
Off. No alerts are configured.
Figures. Colors only the value of the cell.
Blocks. Colors the background of the cell so that the value is still visible.
BlocksOnly. Colors the whole cell so that the value is not visible.
Gradient. Colors a gradient background.
Bar. Choose between blue, red, or green to color the background of the highest value cell in a gradient effect.
Gauge. Select the type of gauge image from the dropdown menu to appear next to each value depending on the parameters set above.
Analytics
Apply Analytical Functions to a Cube
Function. Choose an analytical function to apply. Read about the various Analytical Functions.
For every function, that you can pick from the "Function" dropdown menu, you will have the following settings:Time Entity. This dropdown menu allows you to decide at which level your period is defined. If I use the Max Value function, for example, and I choose Day as the Time Entity, the function will return the amount of the day that contained the maximum value. Otherwise, if I select Month as Time Entity, it will return the value of the month with the maximum value. With the "Auto" setting, the system will use the Time Entity in the Cube Structure or, if you have a Time Entity set in one of the axes, it will take it from those fields.
Time Range-To. These two dropdown menus allow you to consider only a part of the time series, deciding which periods the function will consider to calculate the output, from and to.
Positive Values. When enabled, the analytics function will only consider positive values.
The "Ignore Last Period" checkbox is only used for the functions IdsiARX Forecast, Linear Regression and Multiple Linear Regression, and allows you to ignore the last period in your forecast.
Axes area
Configure the axes of your Layout by placing Entities by Row or by Column, if the Layout allows it.
.png "image(3).png")
The Axes area is split into 4 sections.
Entities area. The first section on the left is the Entities area where all the Entities available to the Layout are listed. Above the Entities list is a search bar where you can search for Entities. The Entities area listed in a tree view, so you can see their hierarchy.
Graphical View. Below the Entities area is a Graphical View button. Click it and a new popup window will appear where you can see the Entity tree and relationships. Expand the Entity by clicking the arrow next to the name. Drag and drop the Member into the By Row or By Column area.
Groups. The Groups checkbox shows you Entity Groups.
By Row. The By Row area is where you can drag and drop Entities by row.
By Row acts as the "Categories" function in the Board Platform Layout for Charts and as "Points" for a BubbleChart.
Display. Choose what you'd like to display: code, description, or code and description.
Show all. When enabled, it displays all rows, including those with no values. This option is disabled by default, therefore only rows containing values are displayed.
Down Totals. Allows enable or disable the column totals, for all blocks of the layout.
By Column. The By Column area is where you can drag and drop Entities by column.
Not all Objects allow a dimension by Column; those that do not allow Entities set By Column are as follows: Cockpit, Treemap, and Fields. By Column acts as the "Series" function in the Board Platform Layout for Charts.
Display. Choose what you'd like to display: Code, Description, or Code-and-Description.
Show all. When enabled, it displays all columns, including those with no values.
Alignment. Here you can configure the alignment of the Totals.
Totals alignment. Choose the alignment for where to display the Total columns in the Object: right, left, or center.
Align. Choose whether to align the Layout horizontally or vertically.
Filters area
Configure sorting and filtering based on each Block in the Layout.
.png "image(4).png")
The Filters area is split into 4 sections:
Blocks. Lists the Blocks available in the Layout. Drag and drop a Block into the Sort "By", Filter A "On", or the Filter B "On" areas that say "Please drag a block".
Sort. Configure a sorting rule for a specific Block.
By. Drag and drop a block here to configure a sorting rule.
Descending/Ascending. Select the order of sorting.
Keep Top. Display a given number of rows and columns. For example, writing 10 will only display the first 10 rows based on the condition.
Keep Totals. When enabled, calculates totals only for visible rows and columns. If the option is disabled, row and column totals will be calculated considering all rows and all columns defined by the Layout, regardless of their visibility.
Filter A & Filter B. In the Filters area you can also define one or more filtering conditions based on Block values.
Leaving the "Min" or "Max" fields blank will not apply any limit.
When multiple filtering conditions are defined, they can be combined using the following logical operators:
AND. Requires that all filter conditions are true.
OR. Requires that at least one condition is true.
To apply a filter or a sort, refer to "Blocks" above.
You can only apply 1 sort to 1 Block in a Layout. You can only apply 2 filters to at least one and at most 2 Blocks in a Layout. However, an algorithm Block can combine more than 1 or 2 conditions to more flexibly filter and sort as required.
Options area
The Options area is different for every different kind of Object. The following Objects have an Options area which are described in more detail in the articles Create a Layout with Excel Add-in and Create a Layout with Word Add-in:
The Word Add-in Object Field does not have an Options section.
Object settings in PowerPoint are the same as in Word Add-in. Read about the options available in Create an Object with Word Add-in.
Select area
You can add a Select to the Layout:
.png "image(5).png")
To do so, follow the instructions below:
Click "Add Select".
Choose an Entity from the dropdown menu.
Enable Keep or To.
Keep. Keeps the currently active Sheet selection on the selected Entity and applies the new one.
To. Overrides the currently active Sheet selection on the selected Entity and applies the new one.
Click "Set" to Select 1 or more members to Select.
To learn more about selections, read about the Board Excel Add-in Selections.
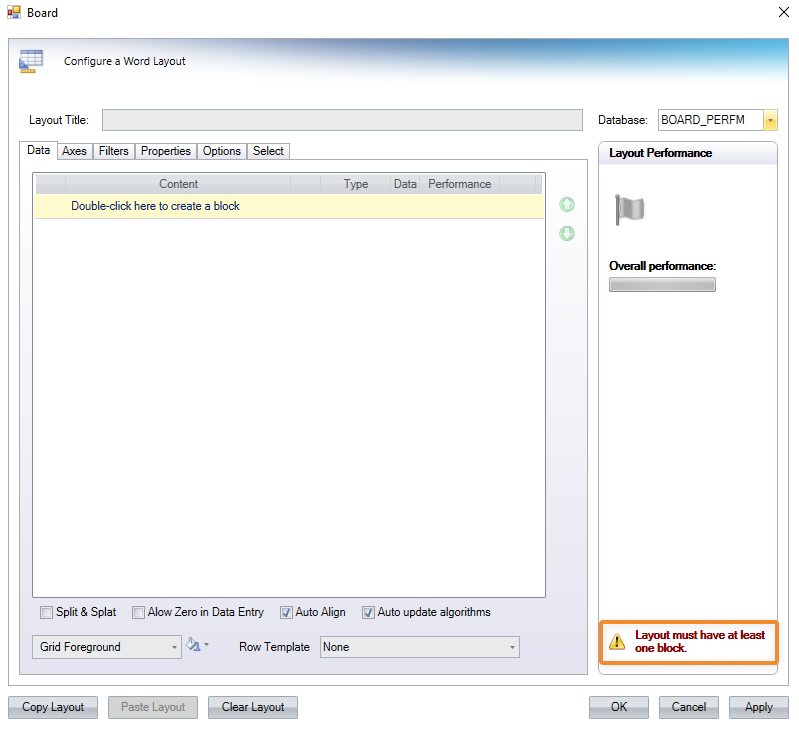
Layout Performance area
The Layout performance area gives you an overview of how well the Layout is performing and if it is compliant with the specific Object's requirements.
If something is wrong with the Layout, a message in red will appear at the bottom of the area, like in the image below: