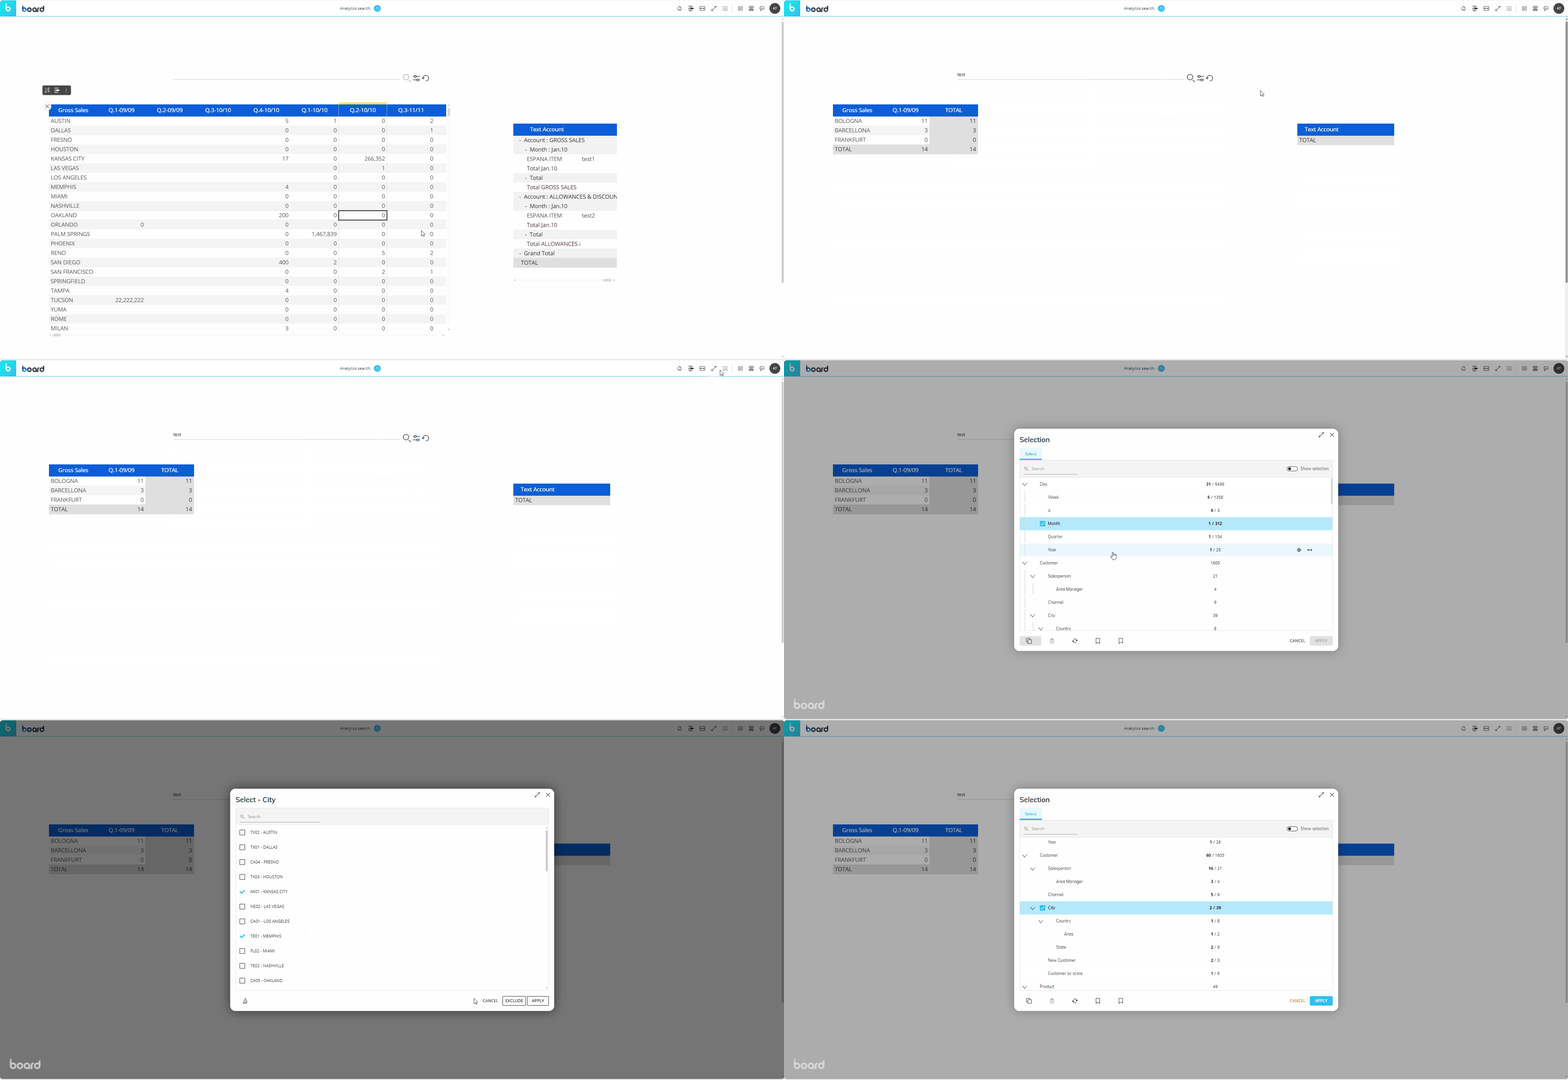
The Object offers different search string matching options to compensate for typos and misspelled terms, to adjust the level of similarity between the input string and search result, or to search for all words of the input string or any of them.
The Text Analytics Search Object, just like every other Board Object, can be formatted to match the graphic style of your Capsule.
A Text Analytics Search Object is a Screen Object that allows users to input a free-text search string and dynamically filter the data displayed by other Objects (charts, tables, selectors, etc.) on the same Screen or in the same Container, by searching within a configured text Cube (a Cube whose contents are text values).
A Screen is a workspace within a Capsule that hosts Screen Objects such as Charts, Tables, Buttons, and Selectors, configured through Layouts to display and interact with data from one or more Board Data Models.
In Design Mode, a Screen serves as the design canvas where Screen Objects are placed and configured.
In Play Mode, it becomes the interactive interface for navigation, filtering, drilling, and data exploration, subject to permissions as granted through the Security Profiles.
See also:
A Container in Board is a special Screen Object that can hold and organize other Objects (and even nested Containers) on the same Screen, enabling layouts such as Tab, Panel, Matrix, Book, Tile view, Transition, Expander or Responsive displays.
Containers help manage screen space efficiently, enable Object grouping, and support limited navigation (e.g. switching tabs, sliding panels) without over-crowding a Screen.
An Object (aka Screen Object) is a visual or interactive component that can be placed on a Screen or within a Capsule that displays data or provides interaction (e.g. Charts, Tables, Selectors, Buttons, Labels), driven by a Layout and configurable with common properties.
- A Layout Object is not a "Screen Object" in the same sense. It is the query definition attached to other Screen Objects about which Cubes, Entities, and calculated fields to retrieve and how to aggregate them.
- A Dataset Object provides a semantic layer definition for data reuse across functionalities. It is also not a Screen Object, but is used for shared data access purposes in Board Foresight and the Microsoft365 Excel Add-in.
So while Layouts and Datasets are called "objects" in a broad sense, they differ from UI Objects because they do not directly appear on Screens (they don’t render visuals themselves) and instead represent data definitions or structured query artifacts within the Board ecosystem.
A Cube in Board is the multidimensional data-storage Object in Board’s FP&A system. Its dimensions are usually Entities or Relationships whose intersections are cells that hold values, enabling drill, slice/dice, forecasting, spreading, workflow inputs, and auditable planning.
The values can be numeric, text, date, or BLOB values (images and files). New or modified Cube values can be written back to the Engine's Data Models via the Data View and Flex Grid Objects.
Numeric cells allow top-down allocation via "Split & Splat" and aggregate recomputation. Cubes can be computed with Dataflows/Algorithms, secured with Cube visibility, and created as MOLAP or RDB architectures.
A Cube can have up to 256 versions, although generally most Cubes have only one version.
An Entity is a taxonomical dimension defined as a set of homogeneous items, each identified by a unique Code and Description, by which data can be organized, filtered, and summarized in Cubes and Layouts.
The individual values of an Entity are called Members; for example, the Entity called 'Month' might have Members such as Apr.2010, May.2010, Jun.2010, Jul.2010, etc.
Entities provide the structural axes of the multidimensional Data Models, and Relationships define the many-to-1 links between them.
