This topic describes how to add a new Chart Object to a Screen or a Container and its specific properties.
To create a new Chart, you need to access a Screen in Design Mode.
Once you sre in the Screen editing page, locate the desired Chart type from the Screen Objects list in the left panel, then drag and drop it onto your Screen or Container.
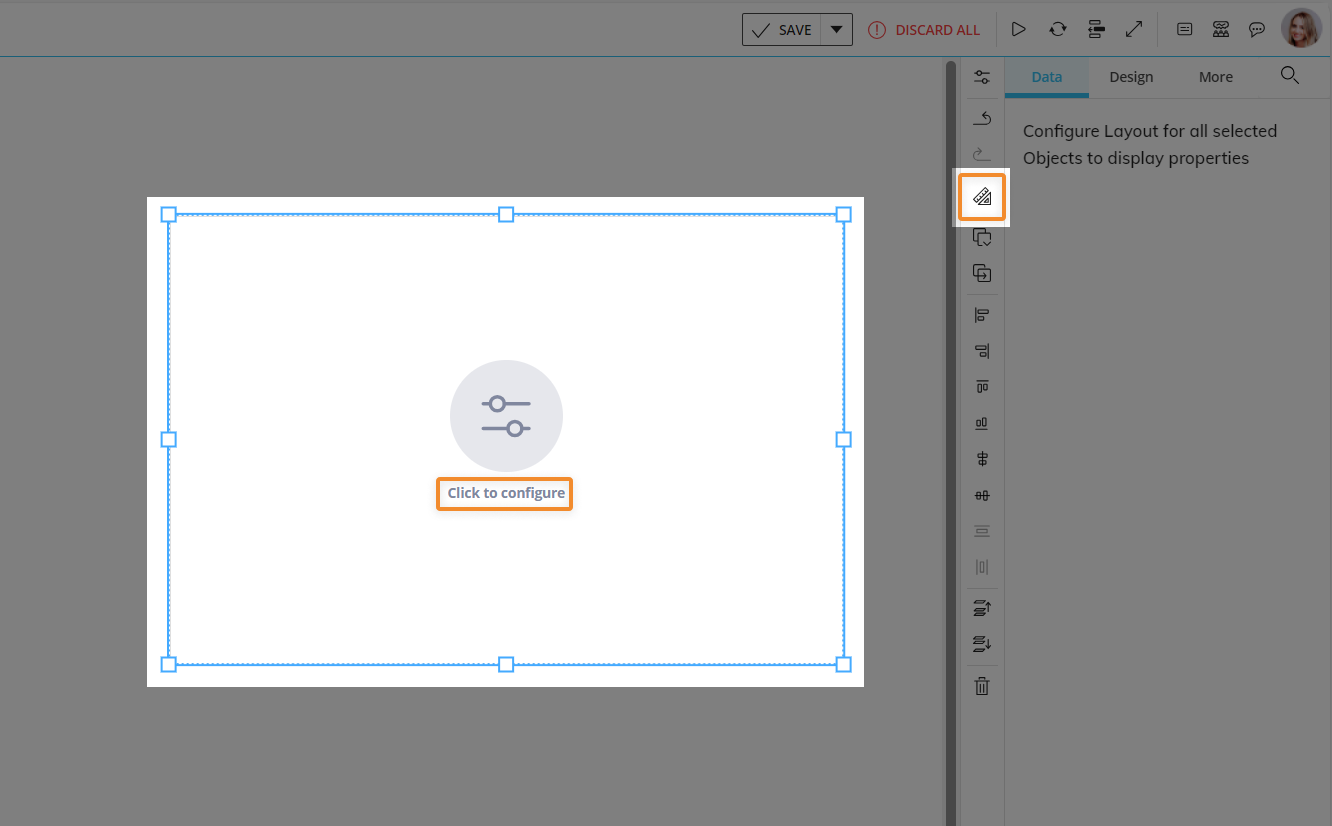
When you create a Chart, it is initially empty. The next step is to configure a Layout that will define the data to be displayed in the Chart.
To configure a Layout for a Chart, click the configure icon within the empty Object or select the Chart Object and click the "Configure Layout" icon (![]() ) located in the Properties toolbar to the right side of the Screen.
) located in the Properties toolbar to the right side of the Screen.
See The Layout Object, Configure a Layout, and About Data Blocks of a Layout for more details on the Layout Object.
Just like every other Object, the Chart can be moved, resized, duplicated via copy/paste, and easily aligned with other Objects on the Screen.
See Configure Screen Objects for more details.
Jump to:
Chart Layout
The Layout editor for Chart Objects is slightly different from the classic one in that it offers some chart-specific options and properties.
The main differences are highlighted in the image below:
The Axes area
Depending on the chart type, in the Axes area, you can define categories, series, rows, columns, points, and other dimensions.
If you add two or more Entities in the "Categories" field, Board will group them according to the following criteria:
If Entities are related (i.e. they are part of the same hierarchy), the most-nested Entity in a Relationship is always arranged in the rightmost position, and you won't be able to rearrange their order. The least-nested Entity will appear on top of the chart (Entity Grouping), while the most-nested Entity will be shown in the primary X-axis.
If Entities are not related, you can freely rearrange their order in the field. To do so, drag and drop them in the desired position. The least-nested Entity will appear on top of the chart (Entity Grouping), while the most-nested Entity will be shown in the primary X-axis.
The Chart Object doesn't support multiple Entities in the "Series" field. Entity grouping is supported only on Cartesian and Waterfall charts. In all other cases, only the most-nested Entity (i.e. the one in the rightmost position in the "Categories" field) will be shown in the primary X-axis. See Charts properties and settings for a full description of options specific to each chart type.
Object properties
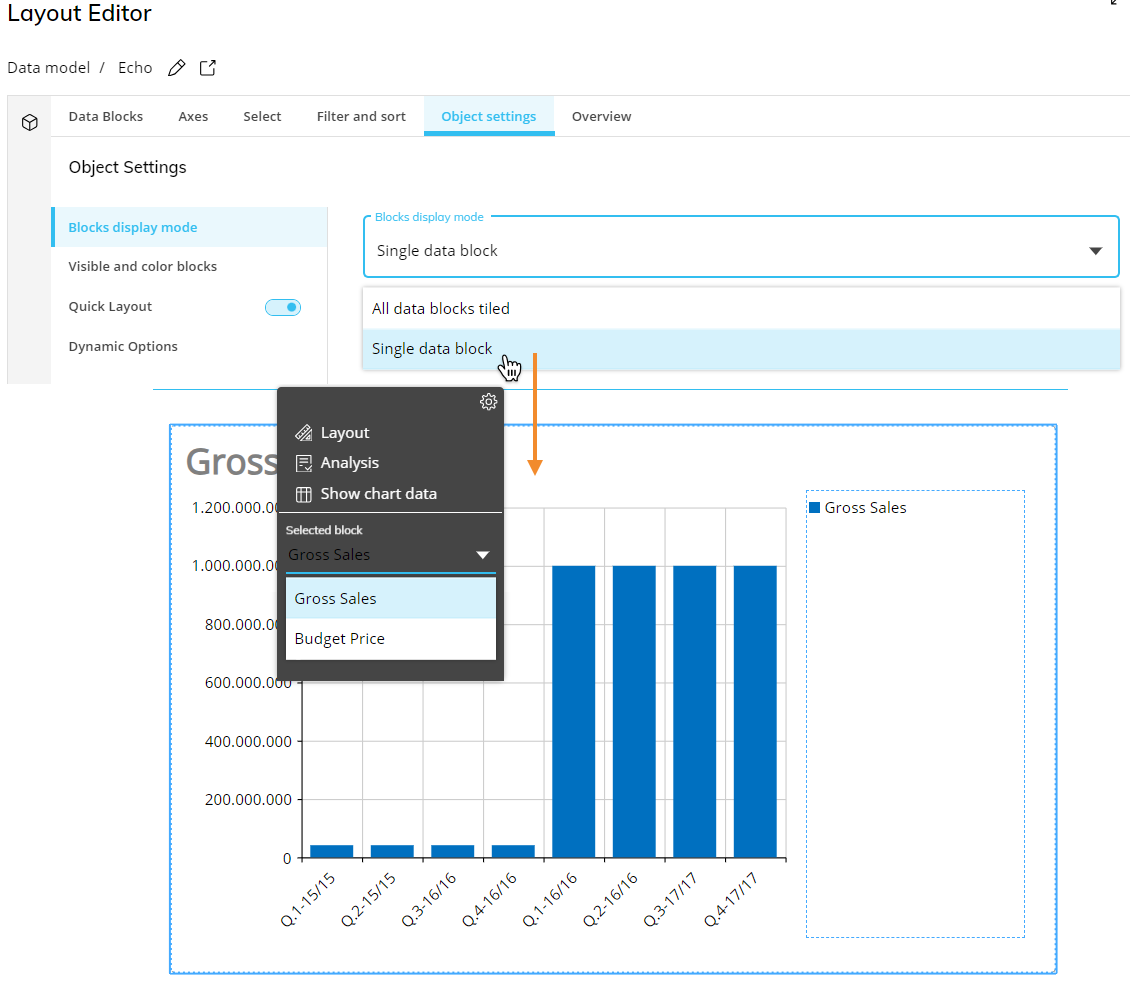
In the Layout editor, under the Object settings subpage, the "Block display mode" menu lets you choose between two display modes for Blocks in the Layout:
All data Blocks tiled. One block is viewable at a time: enable this option to view each Block in the Layout.
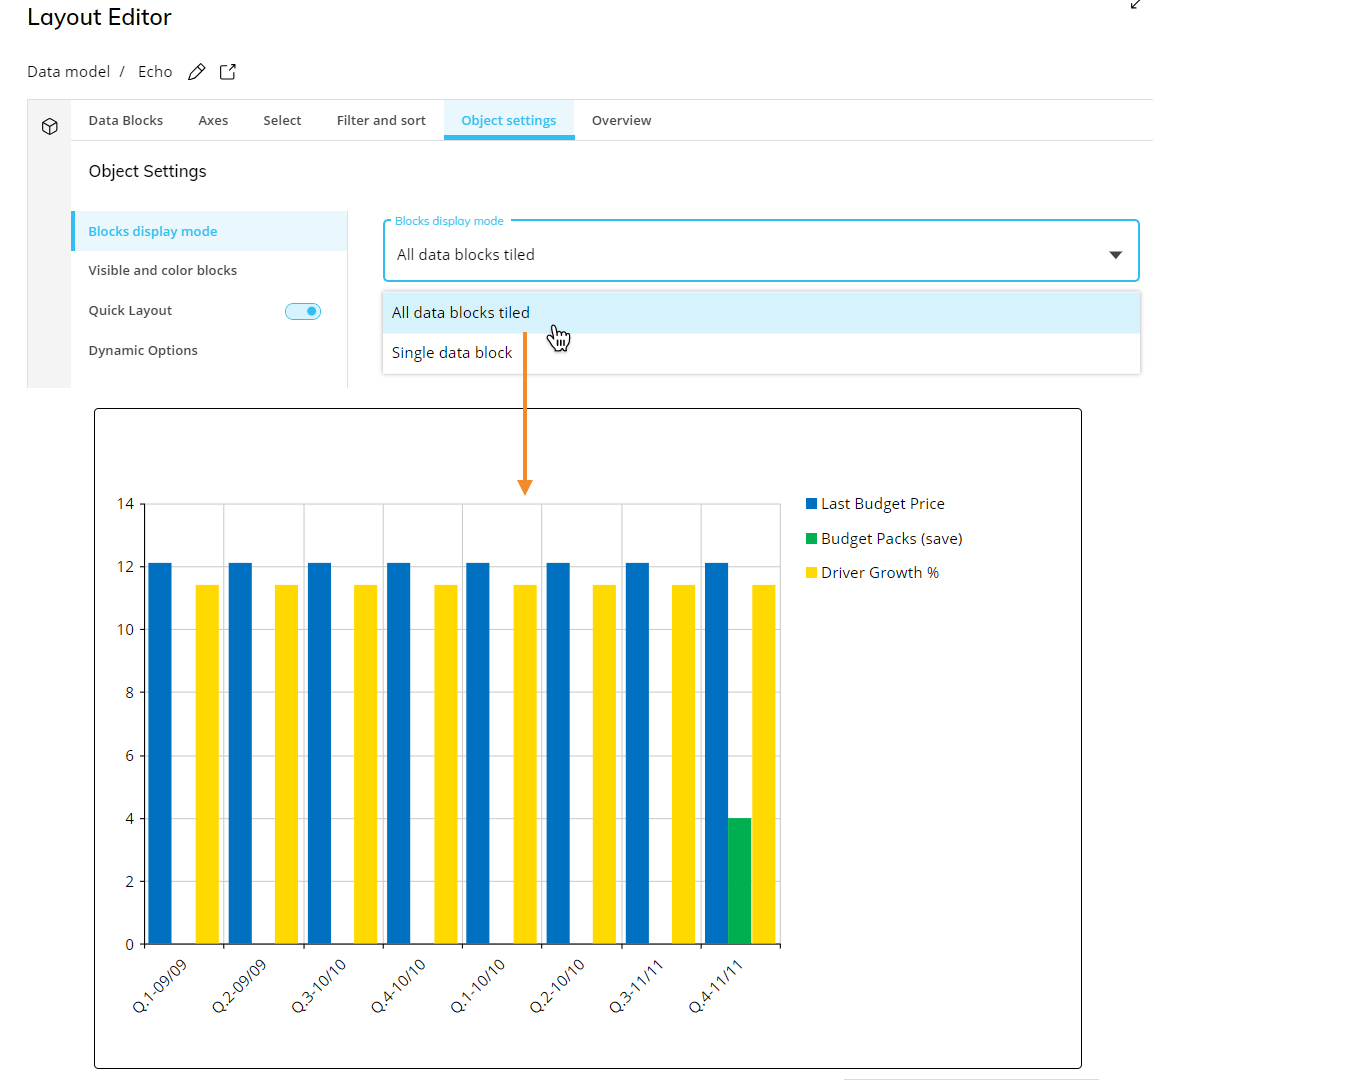
Single data Block. Multiple Blocks stacked, clustered, or as different types: enable this option to view all Blocks at once on a single Chart Object. You can select which Block you want to display from the sliding toolbar in Play Mode.
The "Visible and color blocks" menu lets you show/hide Blocks in the chart and configure a color alert that will be shown in the chart background.
To hide a Block, open the dropdown list and deselect the Block that you want to hide.
Blocks hidden using the dedicated option in the Block settings panel won't be available in the dropdown list. The "Block display mode" and "Visible and color blocks" menus are not available for all chart types. See Charts properties and settings for a full description of options specific to each chart type.
To apply a color alert for the chart background, click on the "Color" field and select a Block with a color alert configured in its Block settings from those suggested.
The color alert will be driven by the values of the selected Block and the chart background color will change accordingly.
Blocks that have been hidden using the dedicated option in the Block settings panel will not be available in the dropdown list.
You can change those settings from the color alert menu in the Block settings panel.
Chart Properties and settings
Chart properties are available from the Object Properties panel on the right side of the Screen editing page once the Chart Object is selected and is associated with a Layout.
Each chart type has its own specific settings and configuration options. However, all charts share
The Object supports all options common to all Screen Objects.
and the following 2 properties:
Master Object. If enabled, clicking on a series, a category or a marker (if available) will update the data displayed by all other Objects on the Screen in order to show only the data relating to the clicked item. The Master Object result is similar to applying a Screen Selection.
Disable Drill down. Disables the drill down functionality on the selected Chart Object, both in Design Mode and Play Mode. (Not available for the Bullet chart).
Read about the chart-specific properties of the following charts:
Interacting with a Chart in Design Mode
In Design Mode, the charts provide the same interactive features available in Play Mode, with a few notable differences regarding the Drill functions.
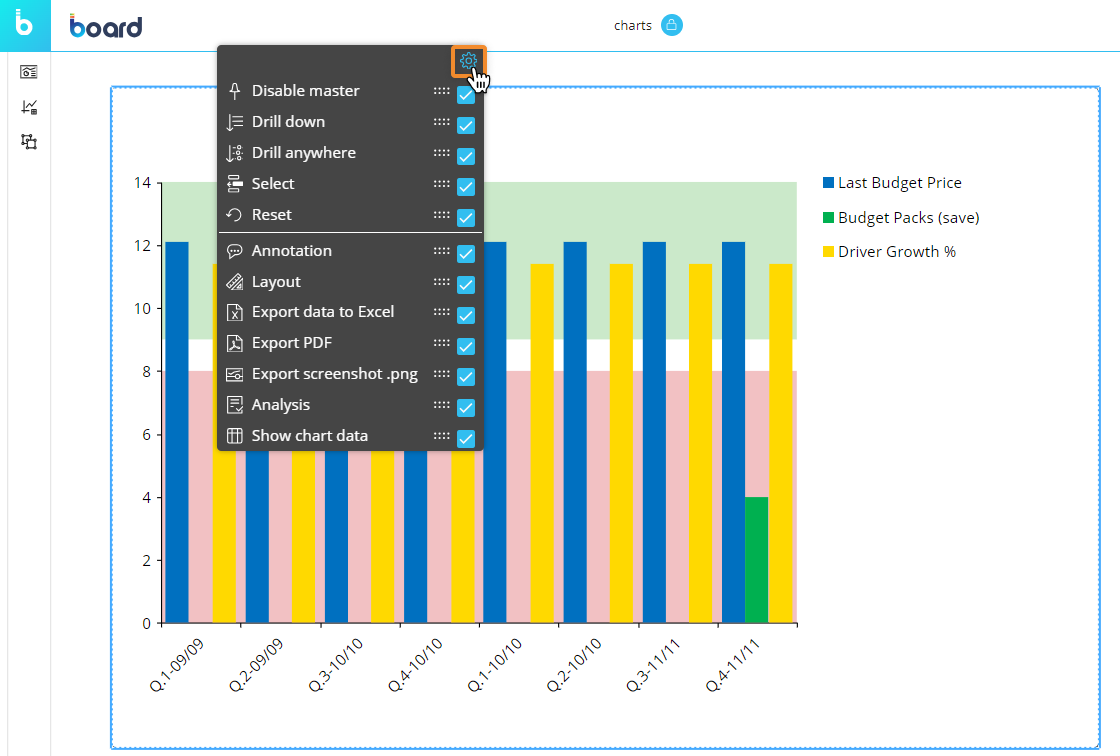
You can also configure which options will be available in the Object toolbar menu (sliding toolbar) in Play Mode. To do so, double-click or Ctrl + click the Object and click the Object toolbar icon ( ) in the top left corner, then expand it by clicking on the 3 vertical dots: the configuration panel is accessible from the cog icon in the top right corner.
Default Drill Down
You can configure a drill-down path that is saved in the chart configuration and performed by default in Play Mode when end users click on the Drill Down button.
The following paragraphs describe the different types of default Drills you can configure and/or allow the end user to configure: Entities, Screens, Procedures, or Drill Throughs.
Drill on an Entity
To configure the default drill on an Entity:
Depending on the chart type, double-click on a data point (a bubble, a bar, a rectangle, etc.) or select it and click the Drill Anywhere icon
 .
.From the popup window, select the Entity to drill down on and click "APPLY". The configured drill is performed and data is displayed in a Data View.
Close the Drill Down window and save the Screen. The configured drill is now the default drill, both in Design Mode and Play Mode.
End users will still be able to configure other drill-down paths in Play Mode, if they're allowed to do so. See Drill-to-Screen, Drill-Procedure, and Drill Throughs below for more details.
Screen selections and Selections made by the user using Selector Objects (if any) also apply to data in drill down windows.
Limit Drill Down Entities
You can limit drill-down paths that Planners are allowed to configure by selecting the Entities that can be drilled down on from the Drill Anywhere configuration window.
To do so, open the Drill Anywhere window in Design Mode and then click on "CONFIGURE" in the top right corner of the window to open the Drill Anywhere configuration window.
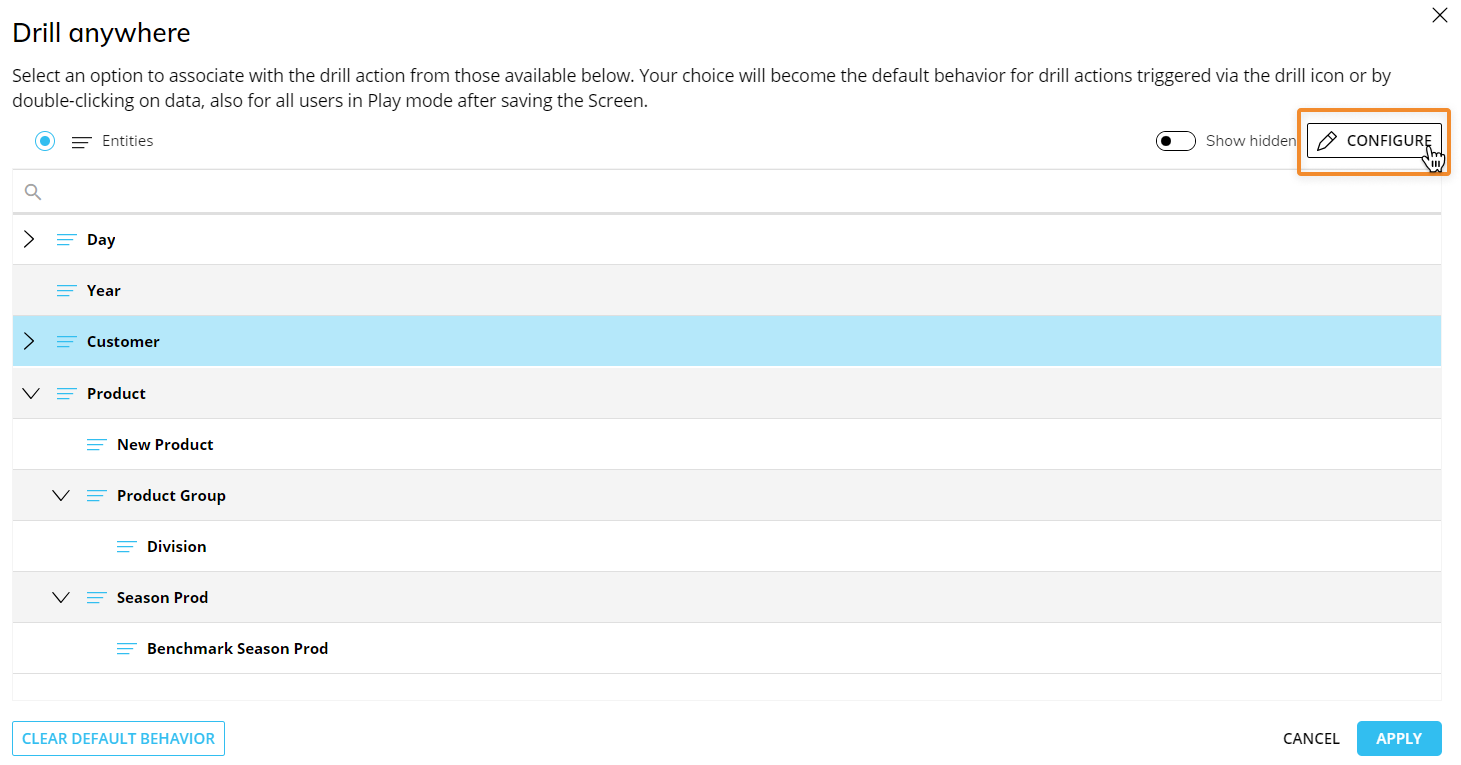
The "Entities" option is enabled and open by default. From here, you can select/unselect all the Entities that you want to show to end users in Play Mode. These Entities will be the only ones available when conducting a drill for both Design and Play Mode, however, in Design Mode, you can see any hidden Entities from the Drill Anywhere window when you enable the "Show hidden" toggle in the top right corner of the window.
All Entities are enabled for Drill Down by default.
Drill-to-Screen
To allow users to drill down from one chart to another Screen within the same Capsule using a selection of the chart:
Depending on the chart type, double-click on a data point (a bubble, a bar, a rectangle, etc.) or select it and click the Drill Anywhere icon
 .
.From the popup window, click on the "CONFIGURE" button in the top right corner of the window to enter the "Drill anywhere configuration" window.

Click on the "Screen" subpage. Enable the toggle next to the Screen subpage title and select all the Screens you would like to allow the end user to drill to.
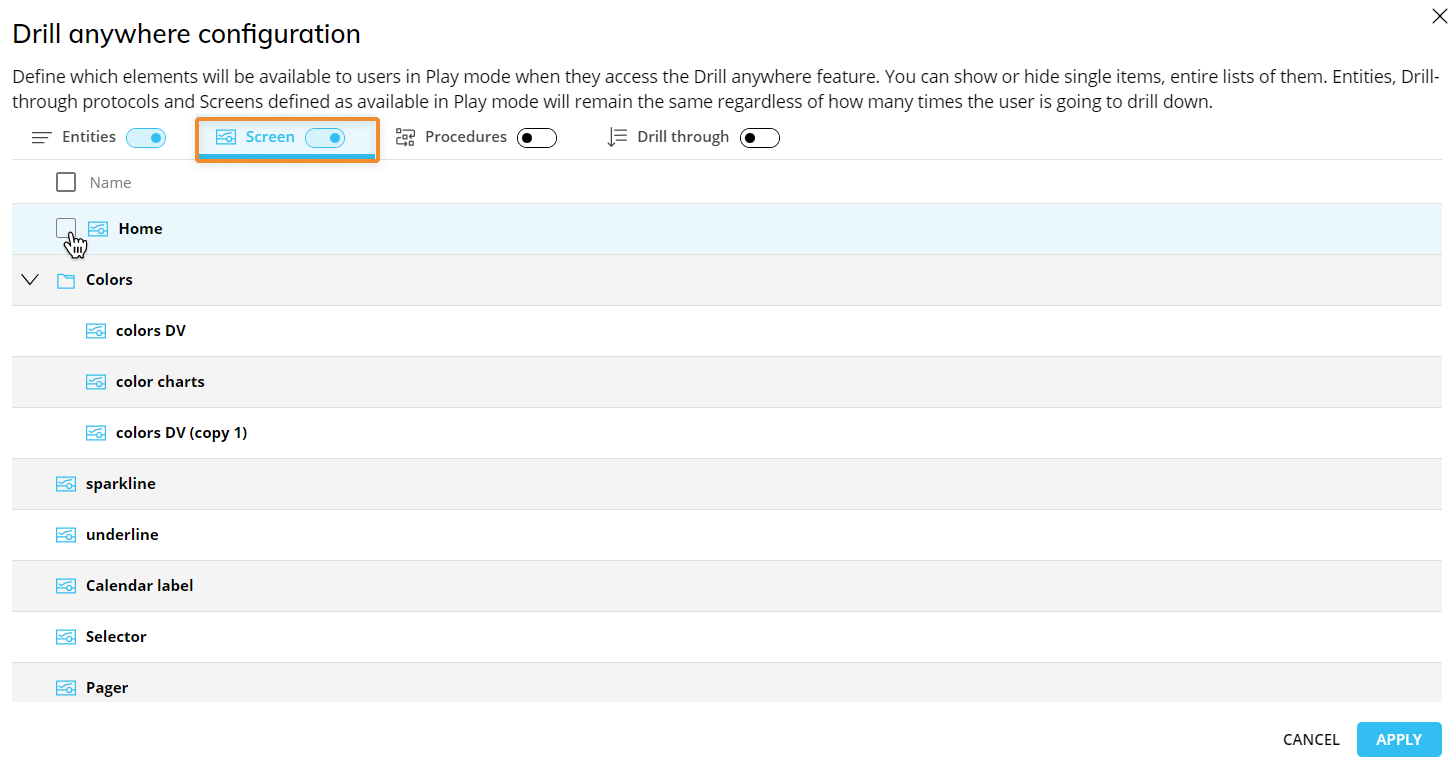
These Screens will be the only ones available when conducting a Drill-to-Screen from the Object in Design and Play Modes, however, in Design Mode, you can see any hidden Screens from the Drill Anywhere window when you enable the "Show hidden" toggle in the top right corner of the window (which also shows you the hidden drills).
Click "APPLY" to close the configuration window.
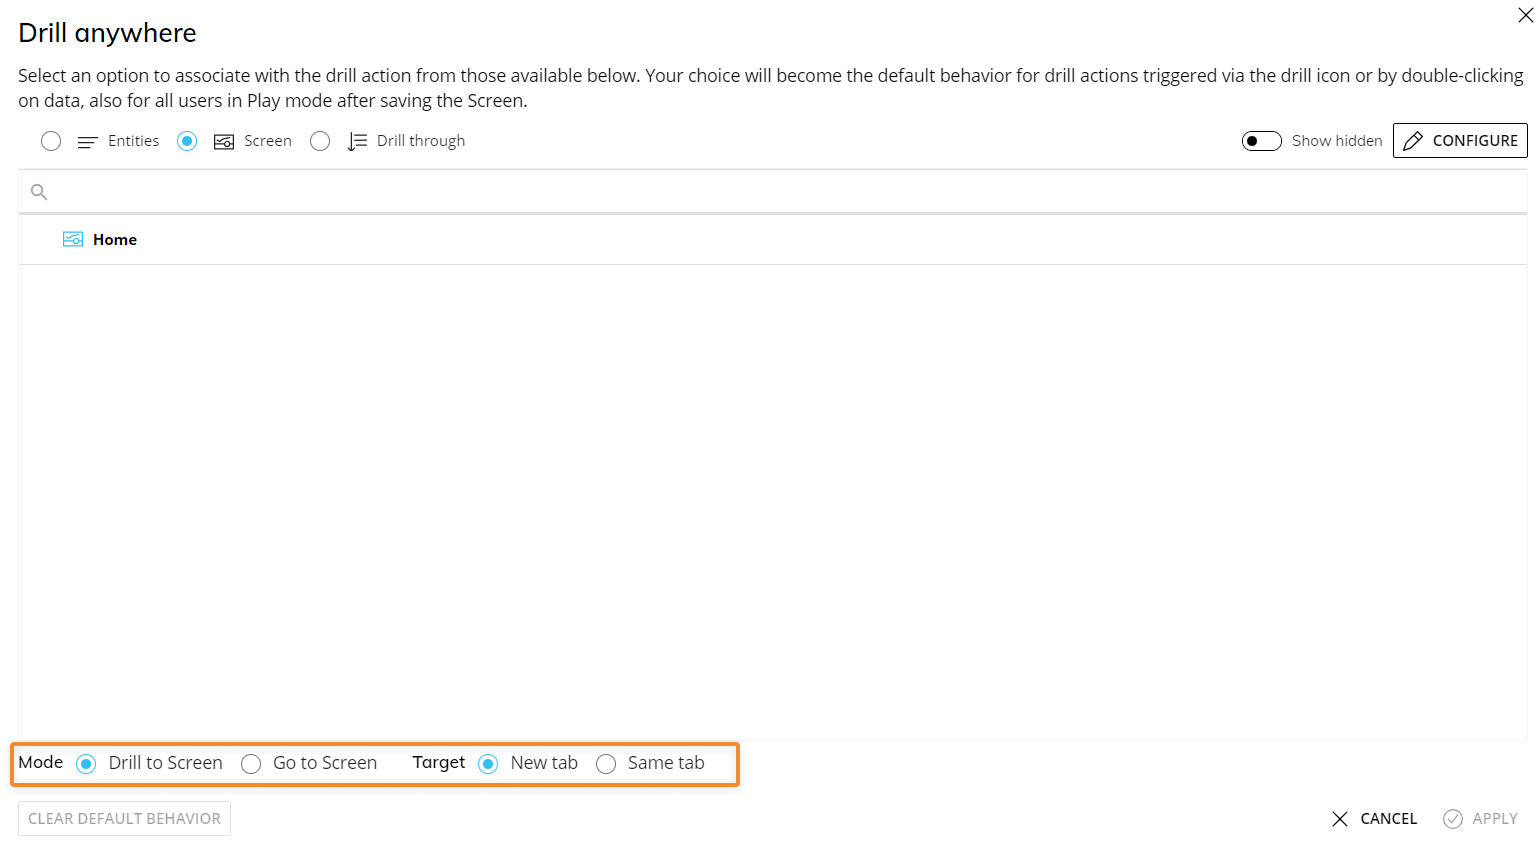
From the Drill Anywhere window, you can now further configure your Drill-to-Screen with the following options:
Select the "Same tab" checkbox to open the destination Screen in the same browser tab.
Select the "New tab" to open in a new tab.
The Drill to Screen mode, if enabled, will open the destination Screen with a Selection on the row header (a member of the Entity set By Row) when the user double-clicks on it or selects it and clicks on the Drill-down icon
 .
.The Go to Screen mode, if enabled, will open the destination Screen when the user double-clicks on a row header (a member of the Entity set By Row) or selects it and clicks on the Drill Down icon
 . The destination Screen will not inherit any Selection from the Data View.
The Dynamic Screen option allow to select a Block (an algorithm) to dynamically change the Screen navigation based on another Block values (a text cube containing Screen names).
Click "APPLY" to save the configuration.
To create a default Drill-to-Screen configuration:
Depending on the chart type, double-click on a data point (a bubble, a bar, a rectangle, etc.) or select it and click the Drill Anywhere icon
 .
.Select the Screen tab. If "Screen" is not yet configured, enable the "Show hidden" toggle in the top right corner of the window.
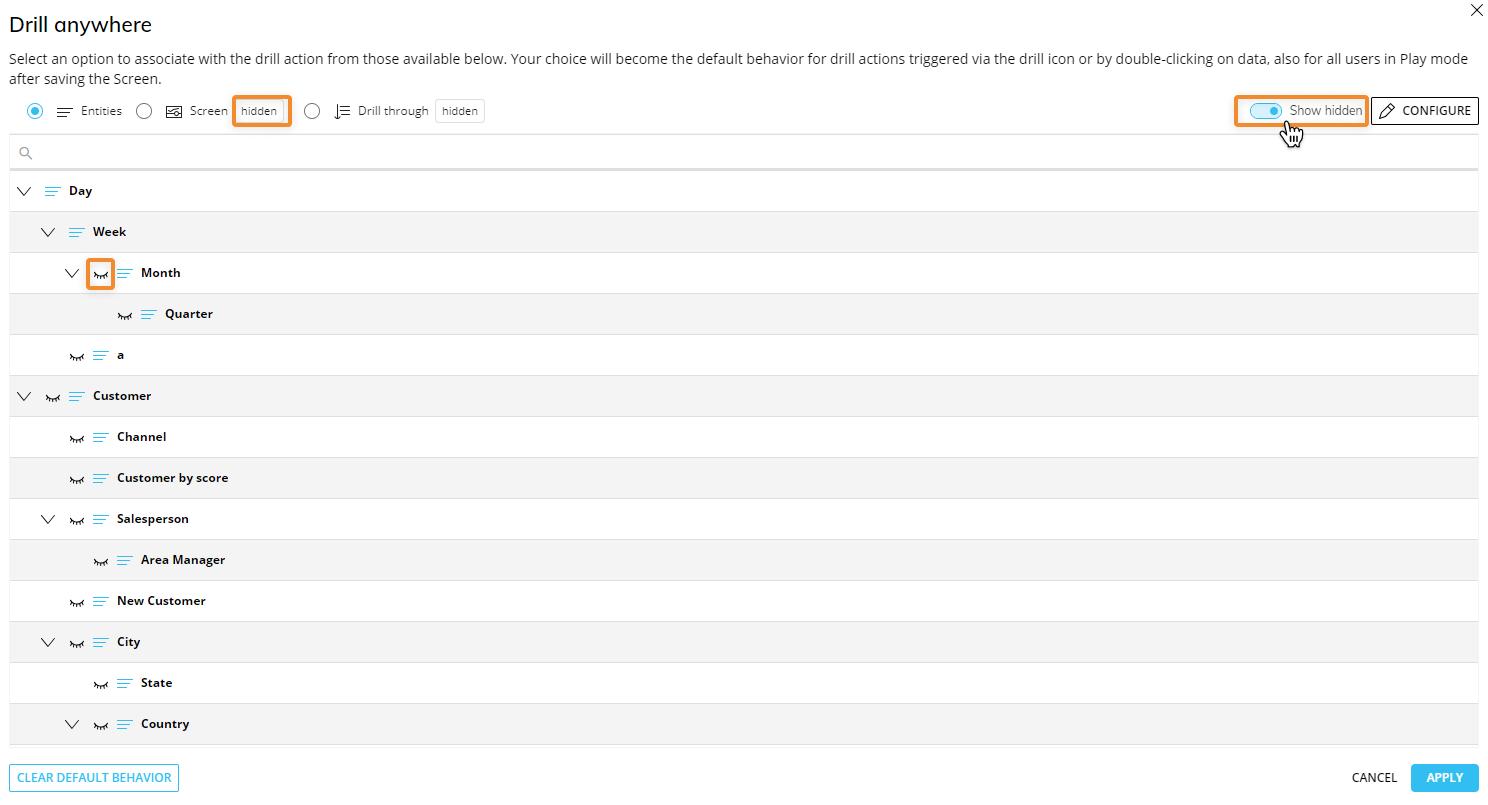
If "Screen" is not yet configured as a drill option for Planners from the Drill Anywhere configuration window, you will not see a Screen tab in the Drill Anywhere window. You can make a default Drill-to-Screen without enabling Drill-to-Screens for the Planners. To do so, enable the "Show hidden" toggle in the top right corner of the window to see all the possible drills. If the drill headers are not configured for the Planners, they have a "hidden" tag next to their heading.
Make a Screen selection and click "APPLY" or double-click on a Screen to save the Drill-to-Screen default configuration and close the window.
The Drill-to-Screen configuration process can also be started by double-clicking on a cell or a row header (a member of the Entity set By Row) if a configuration isn't already set.
This feature allows you to nest your analysis in a more powerful way than the standard Drill Down, which only changes the level of granularity of a report. In a Drill-to-Screen navigation, the data represented (values, indexes) and types of Objects (Charts, Dashboards, Data Views) may vary as the user drills from a top-level view to another Screen at a more detailed level.
Screen selections and selections made by the user using Selector Objects (if any) also apply to data in the target Screen.
Drill-Procedure
It is possible to trigger a Procedure from a chart, when the user double-clicks on a data point or selects it and clicks on the Drill Down icon. The Procedure is launched with a selection filter applied based on the clicked chart element.
If a Drill-Procedure containing two or more Procedures is configured, a popup window allows the user to select the Procedure to run from a configured list when the user double-clicks on a chart element.
To allow Planners to trigger a Procedure from a chart, you must first enable and configure it from the Drill Anywhere configuration window. Once enabled, you can add Procedures you want the user to be able to deploy as well as set a default Drill-Procedure.
To configure a Drill-Procedure:
Depending on the chart type, select a data point (a bubble, a bar, a rectangle, etc.) and click the Drill Anywhere icon (
 ), or you can double-click on a data point if a default Drill has not already been configured.
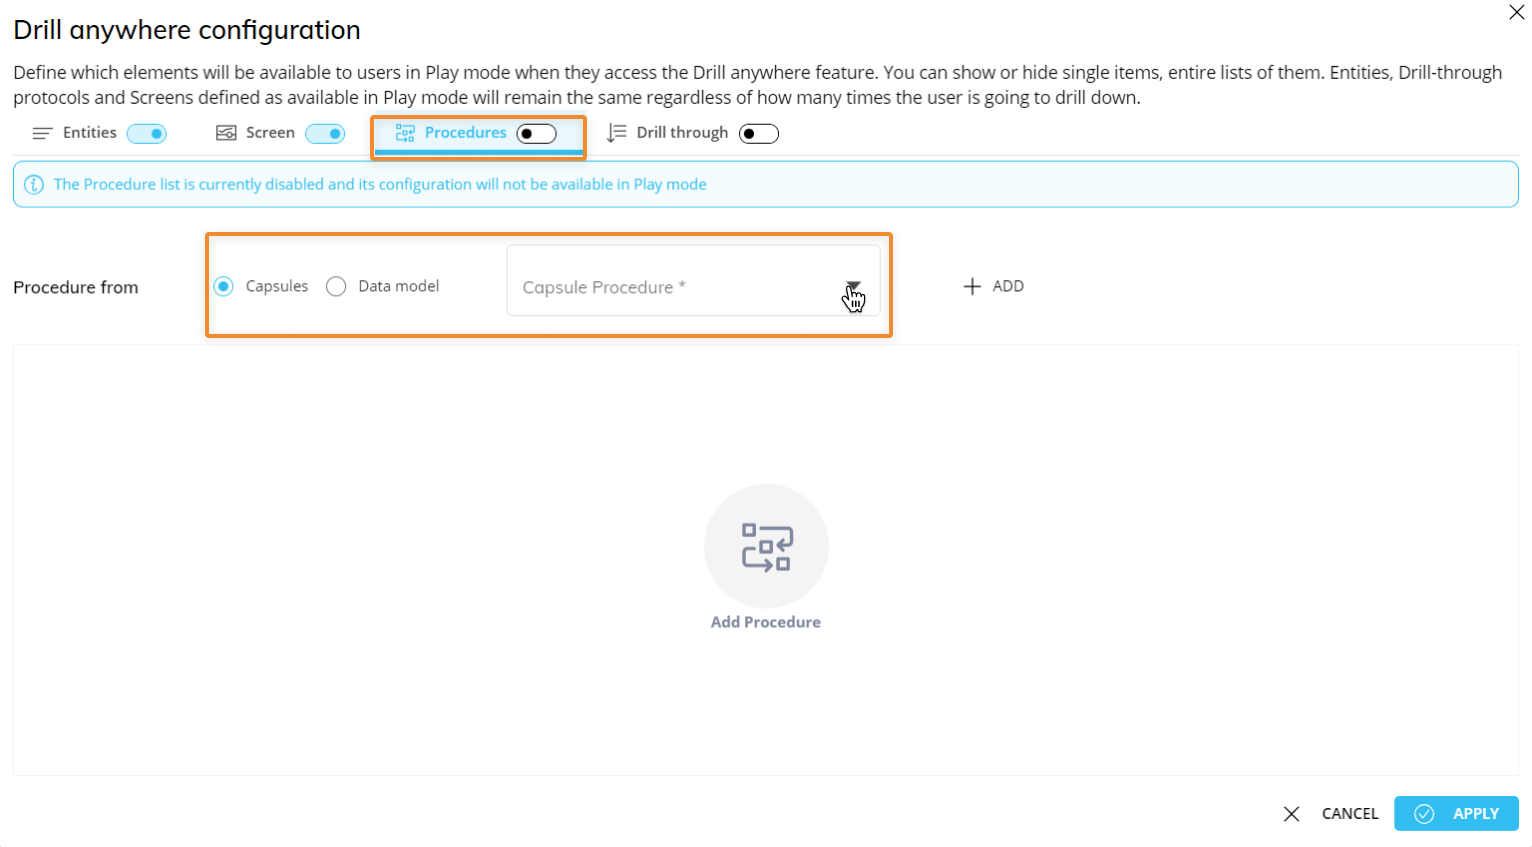
From the popup window, click on "CONFIGURE" in the top right corner of the window to open the Drill Anywhere configuration window and select the Procedures tab.
Select the Procedures for the drill configuration. Choose whether the Procedure comes from the "Capsule" or the "Data model" and then select the Procedure from the dropdown menu (as described below).
Capsule. If selected, the dropdown menu to the right allows you to choose from a list of Procedures saved at the Capsule level.
Data model. If selected, select a Data Model from the dropdown menu on the right. By doing so, only Procedures belonging to the chosen Data Model will display in the dropdown menu to the right.
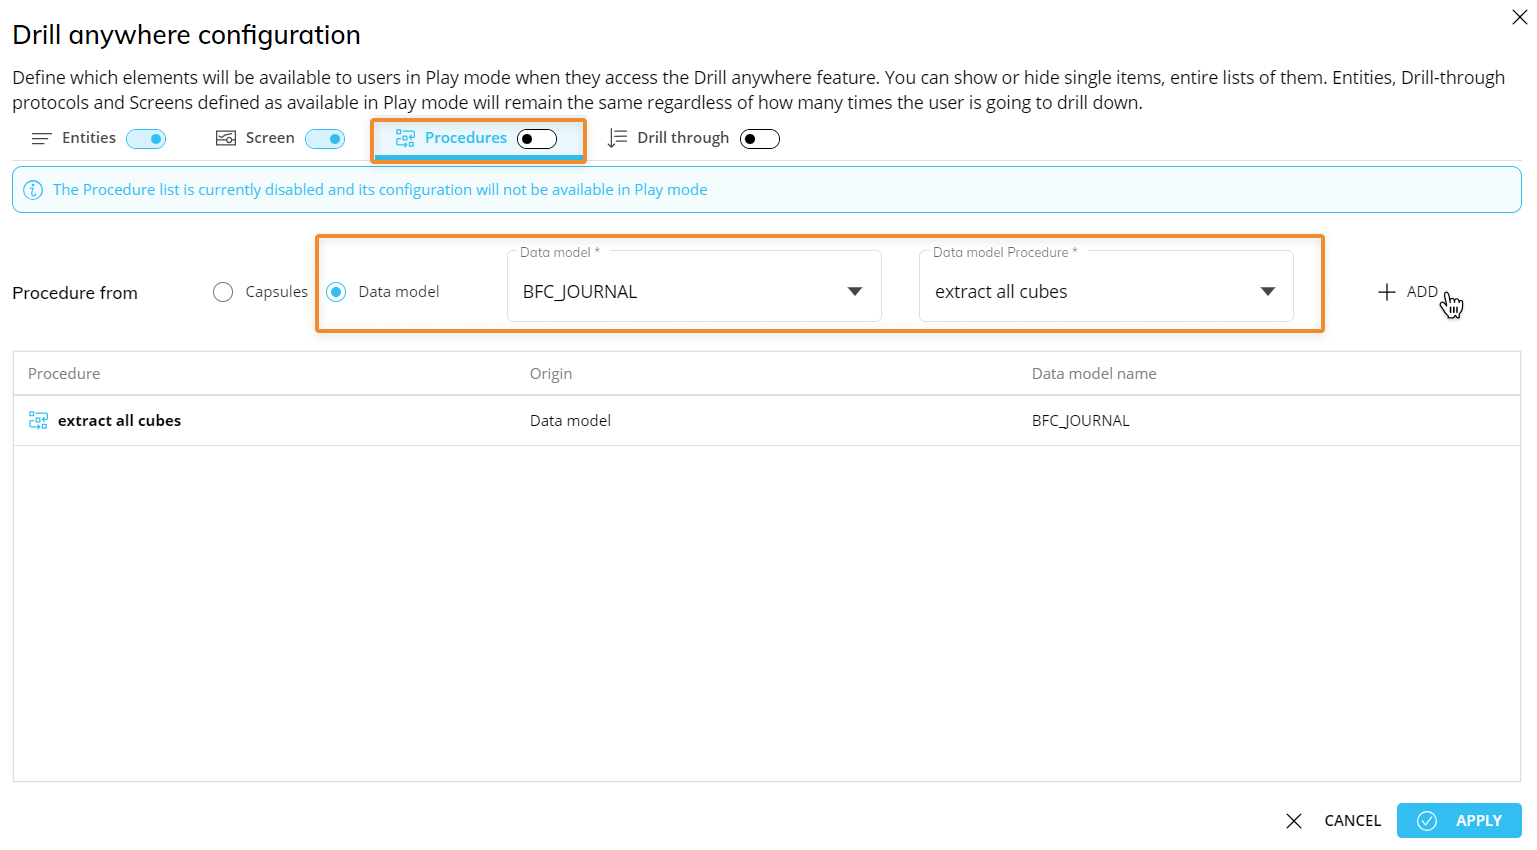
After you have chosen the desired Procedure, click the "ADD" button on the right. Repeat the process for each Procedure that you want to add to the drill.
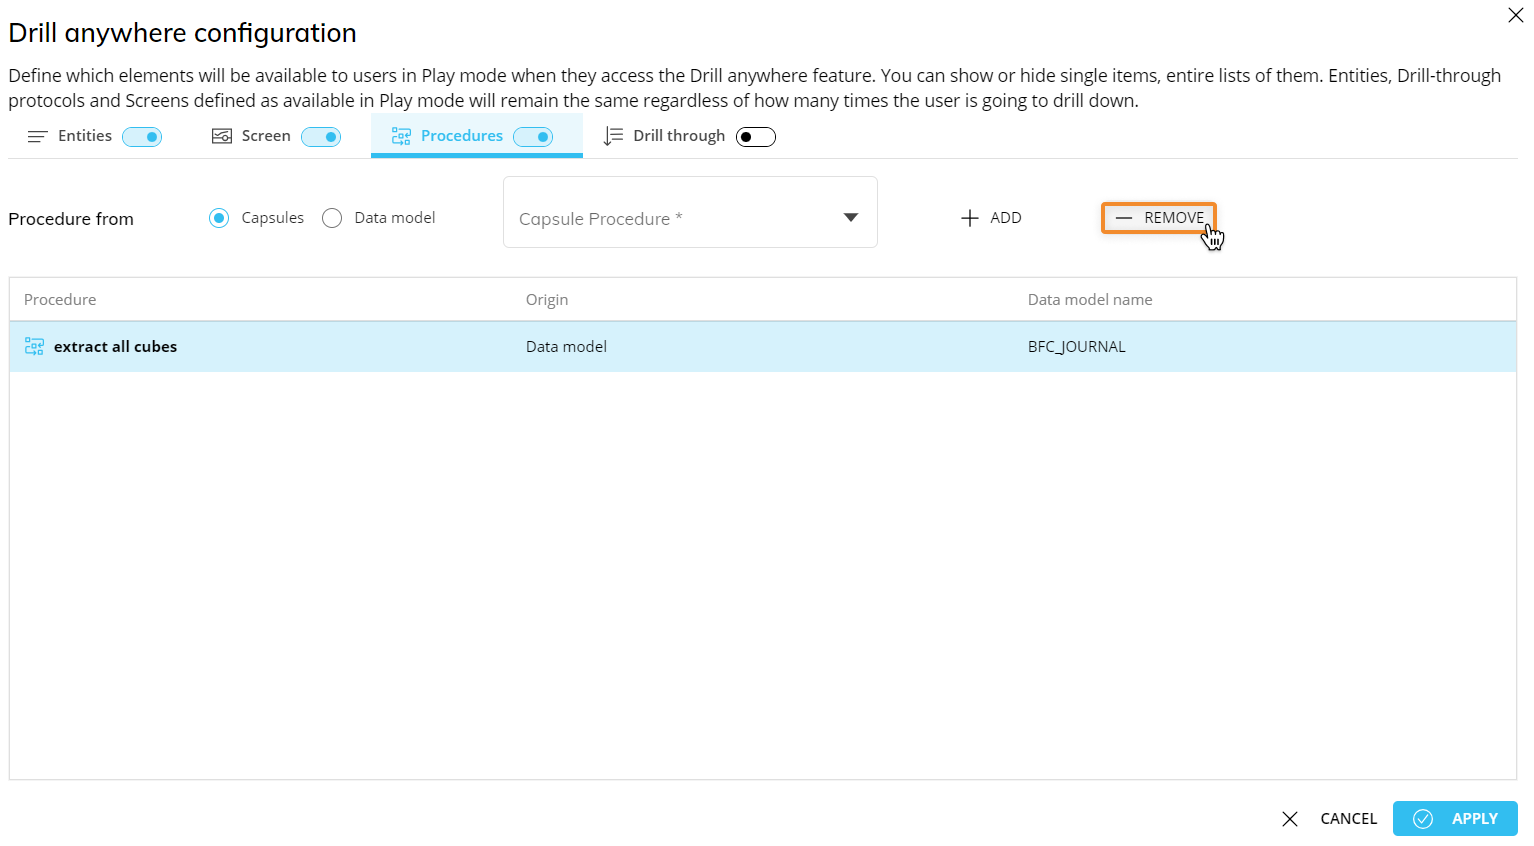
To remove a Procedure from the list, select it and then click on "REMOVE" which will appear next to the "ADD" button.
Enable Procedures with the corresponding toggle by the tab header to allow Planners to configure a Drill-Procedure with the Procedures that you just added.
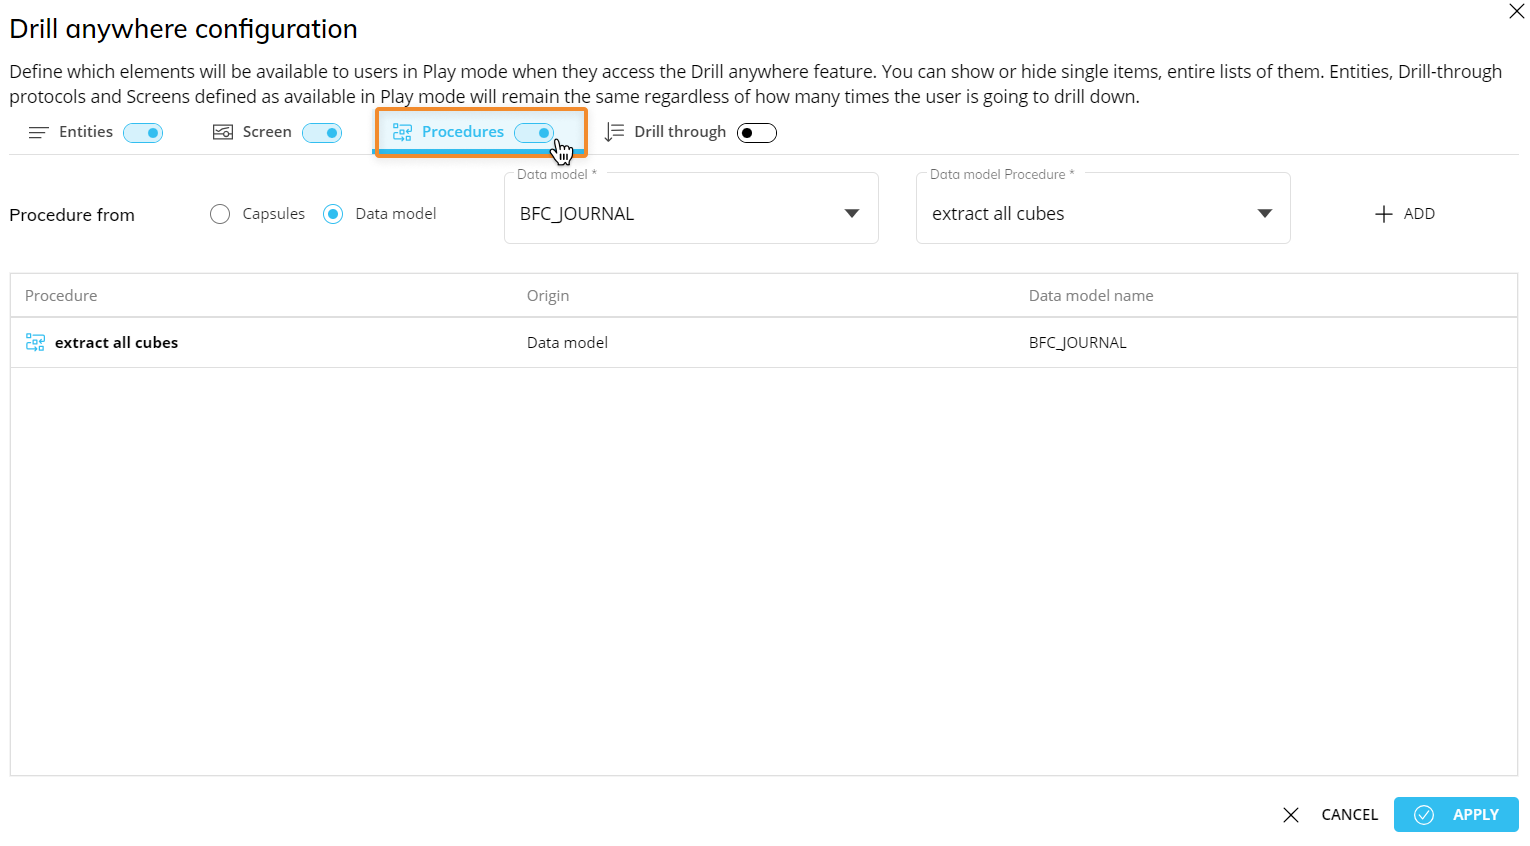
If the Procedure toggle is left disabled, its configuration will not be available in Play Mode.
Click "APPLY" to save the Drill-Procedure configuration and return to the Drill Anywhere window.
Double-click a Procedure or select one and click "APPLY".
Screen selections and selections made by the user using Selector Objects (if any) also apply to data in Drill Down windows.
Drill Through
It is possible to execute a Drill Through from a chart when the user double-clicks on a data point or selects it and clicks on the Drill Down icon. The Drill Through is executed with a selection filter applied based on the clicked chart element.
Drill Throughs are configured in the Drill Through section of the Data Model.
To configure a Drill through on a chart element:
Depending on the chart type, select a data point (a bubble, a bar, a rectangle, etc.) and click the Drill Anywhere icon
 , or you can double click on a data point if a default Drill has not already been configured.
Click on the Drill Through tab and select the Drill Through you would like to be the default action when triggered by a Planner.
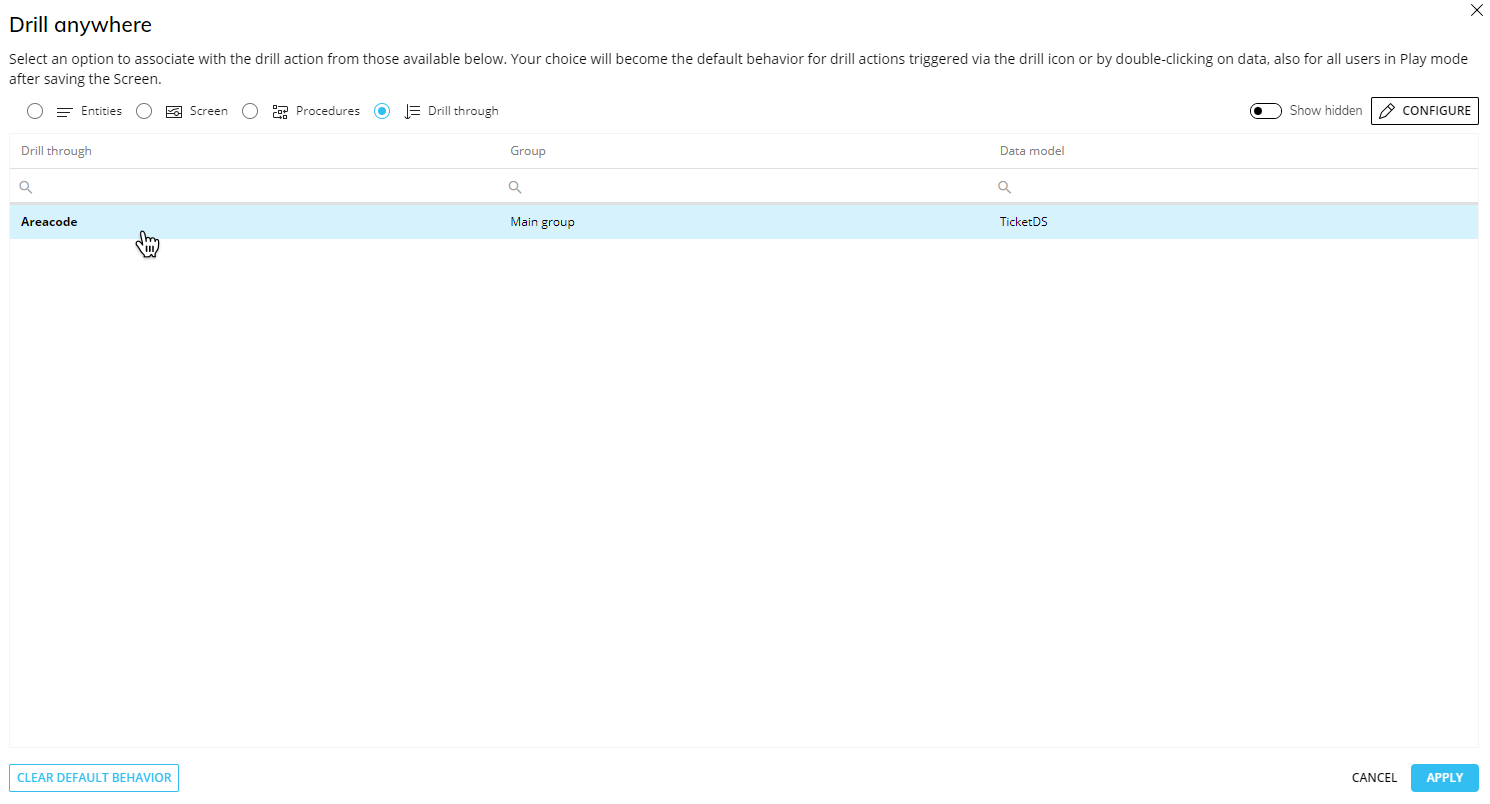
If the Drill Through feature is enabled from the "Drill Anywhere configuration" window, a "Drill Through" tab will be visible. If the Drill Through feature is enabled and you would like to configure a Drill Through on a row header that is not part of the list you configured as available to Planners, you can do so by enabling the toggle "Show hidden" and selecting a hidden Drill Through.
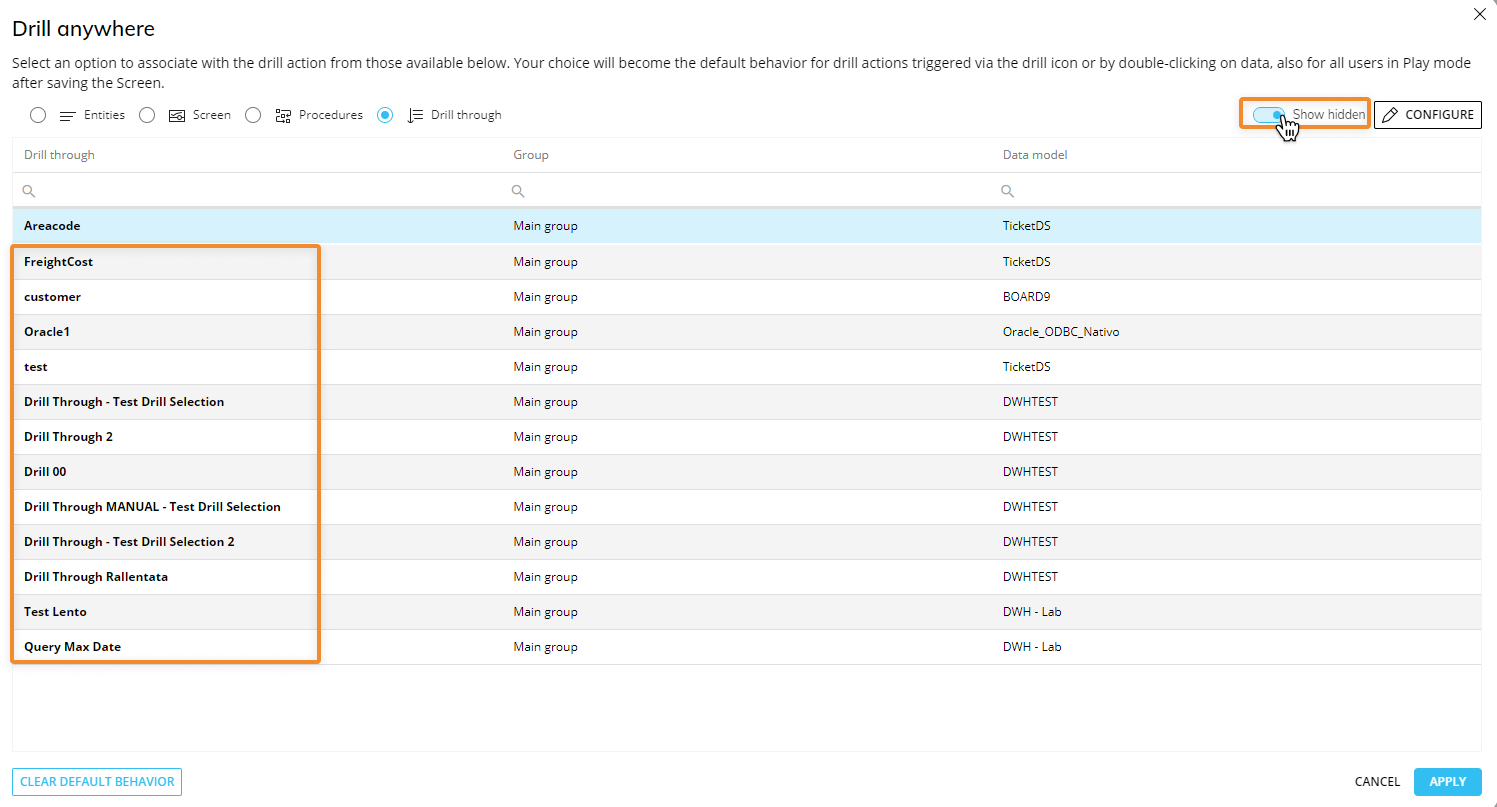 If the Drill Through feature is disabled, you can still apply a default Drill Through by enabling the "Show hidden" toggle in the top right corner of the window and selecting a Drill Through.
Double-click the Drill Through or select one and click "APPLY" to save the Drill Through default configuration.
You can also double-click on the Drill Through which will save the configuration and close the window (and you can skip the 4th step).
In order to configure which Drill Throughs the Planners can use and see in Play Mode:
Depending on the chart type, select a data point (a bubble, a bar, a rectangle, etc.) and click the Drill Anywhere icon
 , or you can double-click on a data point if a default Drill has not already been configured.
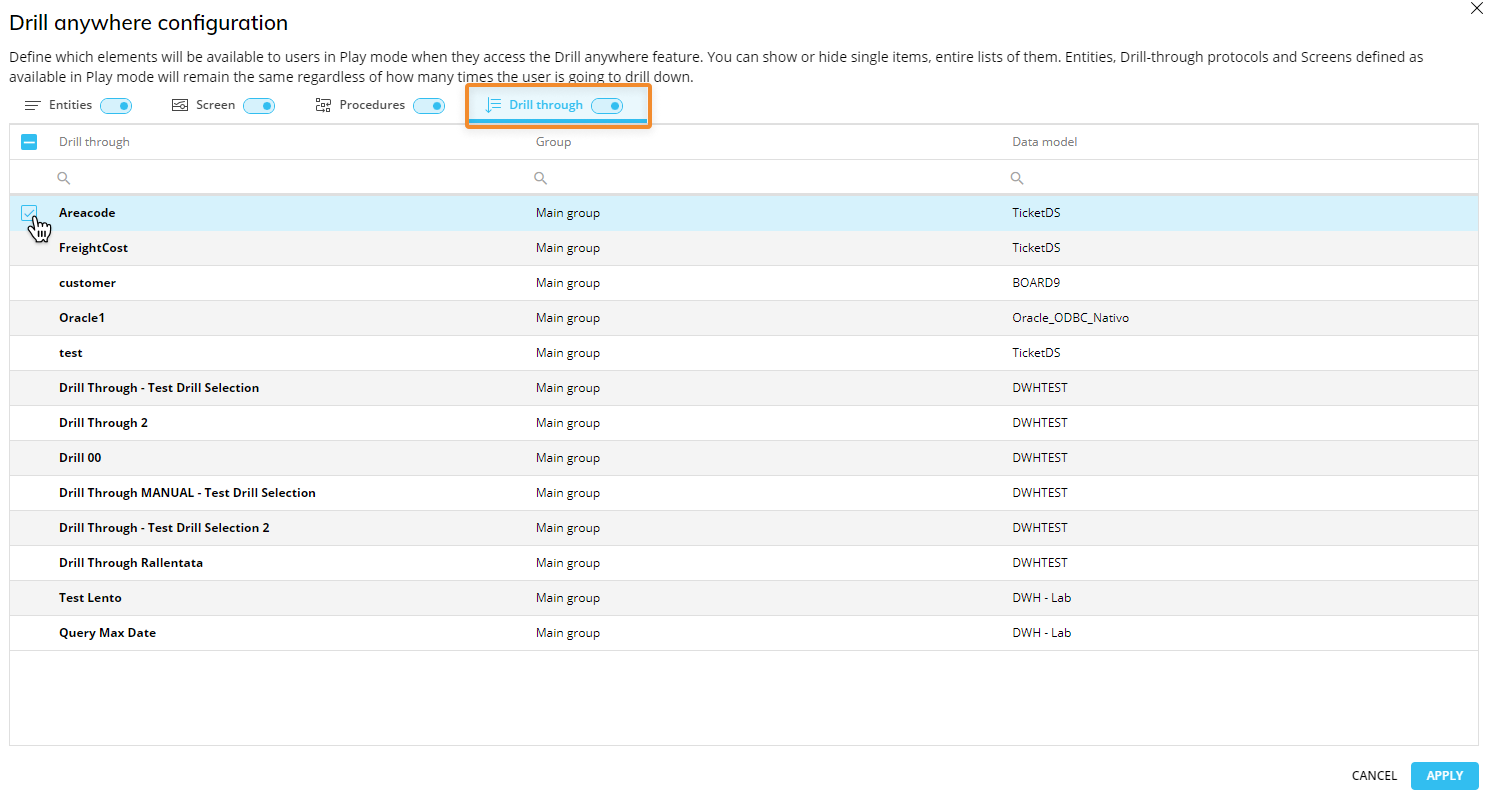
From the popup window, click on the "CONFIGURE" button to open the "Drill anywhere configuration" window.
Select the "Drill through" tab. Enable the toggle next to it and add the desired Drill Throughs you'd like to be available to the Planners below. If the toggle is not enabled, the Drill Through drill down will not be available within the Drill Anywhere window (when accessed by the Object toolbar) for either Developers or Planners.
Click "APPLY" to save and return back to the Drill Anywhere window where you can now configure a default Drill Through.
Click "APPLY" to save the Drill Through configuration.
Screen selections and selections made by the user using Selector Objects (if any) also apply to data in drill-down windows.
Learn more about: