The Chart Object provides the following interactive features:
Any changes made to Charts using the functions listed above will be lost if you leave the Screen or update it, except for data entry actions.
Chart popover
When you hover over a data point of a chart, a chart popover will appear. The popover will display relevant information related to the data point, such as dimension members, values and other chart-specific data or settings.
Pan, zoom, interactive selection
Depending on the chart configuration, you can drag the mouse over the chart to perform a specific action.
Available actions are:
Pan. You can navigate through a zoomed chart by dragging the mouse.
Zoom. You can zoom in the chart by dragging the mouse. Zooming is also possible using the mouse wheel.
Interactive selection. You can select a set of categories in the chart by dragging the mouse. When the mouse button is released, the selection is applied as a Screen selection and all other Objects on the Screen are updated accordingly. To reset the selection, click the reset button (
 ) in the top left corner of the chart.
Example of interactive selection
Actions mentioned above are available on Cartesian (except when the Funnel series type is configured) and Waterfall charts. The interactive selection feature is also available on the Bubble chart. To apply a selection on a chart, you can also select a data point (or more, if the chart allows it) with a single click and click the Select icon (
) that will automatically appear in the sliding toolbar. The selection is applied as a Screen selection and all other Objects on the Screen are updated accordingly. To reset the selection, click the reset icon (
) in the top left corner of the chart.
Master
If the Chart has been configured as a Master Object, clicking on a data point (a bubble, a bar, a rectangle, etc.) will update the data displayed by all other Objects on the Screen in order to show only the data relating to the selected element. The Master Object result is similar to applying a Screen selection.
By clicking on the "Disable master" icon  in the sliding toolbar, you can disable this option. Click on the "Enable master" icon
  to re-enable it.
Drill Anywhere
The Drill Anywhere feature allows you to configure a default Drill Down that will be available for all data points of the chart.
To do so, proceed as follows:
Depending on the chart type, double-click on a data point (a bubble, a bar, a rectangle, etc.) or select it with a single click and click the Drill Anywhere icon (
 ) in the sliding toolbar.
The Entity list you are allowed to drill down on will appear in the drill configuration window.
Select the desired Entity and click "APPLY" to save the drill and to perform it. The configured drill data is always displayed in a Data View.
Once the drill is saved, it can be easily performed again on other data points by clicking on the Drill Down icon  .
.
The Drill Anywhere function is available also in the drill-down windows, so you can create your own drill-down paths at different levels of granularity. Learn more about drilling down in a Data View Object.
Drill Down
Once you have configured a drill using the Drill Anywhere feature, click the Drill Down icon  to perform it on other data points of the chart.
Drill-to-Screen
If a Drill-to-Screen has been configured on the chart, the Drill Anywhere icon  will not be available.
In this case, double-click on a data point or select it with a single click and click the Drill Down icon to follow the drill path from the chart to another Screen of the current Capsule.
Depending on the Drill-to-Screen configuration, the destination Screen will open with:
A selection based on the source data point in the chart.
No inherited selection.
Drill-Procedure
If a Drill-Procedure has been configured on the chart, the Drill Anywhere icon  icon will not be available.
In this case, double-click on a data point or select it with a single click and click the Drill Down icon to trigger the configured Procedure or to choose from a list of available Procedures.
Depending on the Drill-Procedure configuration, the Procedure will run with:
A selection based on the source data point in the chart.
No inherited selection.
Data entry (in Drill Down windows)
Although charts do not allow it directly, you can perform Data Entry actions in Data Views displayed in drill-down windows.
See Data Entry on Cubes and Data Block settings for more details.
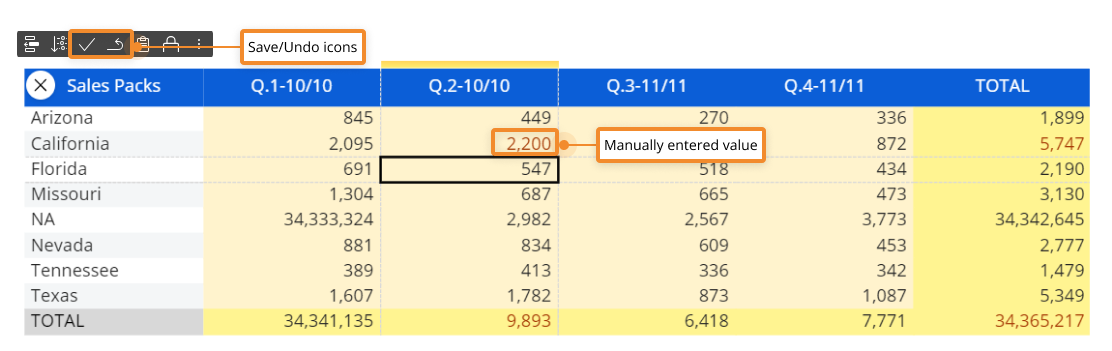
When Data Entry is enabled on a Cube, the background of the totals cells turns yellow, while the background of value cells turns beige (unless otherwise formatted), as in the following example:
To perform a data entry action, double-click on a cell to enter data (either by typing a value, by uploading a file or a picture, by picking a date from a date picker, and so on).
If Save/Undo mode is enabled on the Screen, after you have entered a value, click the save icon  at the top left of the Data View to actually save the value in the Cube. To do this, you can also press the F9 key on your keyboard.
The undo arrow icon allows to restore the last saved values (i.e. it discards all unsaved changes).
Unsaved values and totals that depend on those values are shown in red. When you press the save icon, their text color will change to match the text color of previously saved values, indicating that all changes have been saved in the target Cube.
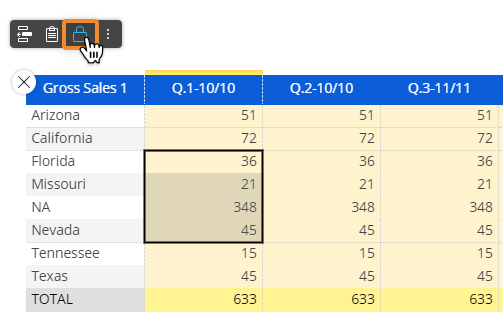
When the Data Entry option is enabled in the Layout, after you have manually entered data in a cell, the Object toolbar in the top left corner of the Data View will automatically show the Save/Undo icons (if Save/Undo mode is enabled on the Screen) and the Lock/Unlock icons (see Lock and Spread for more details).
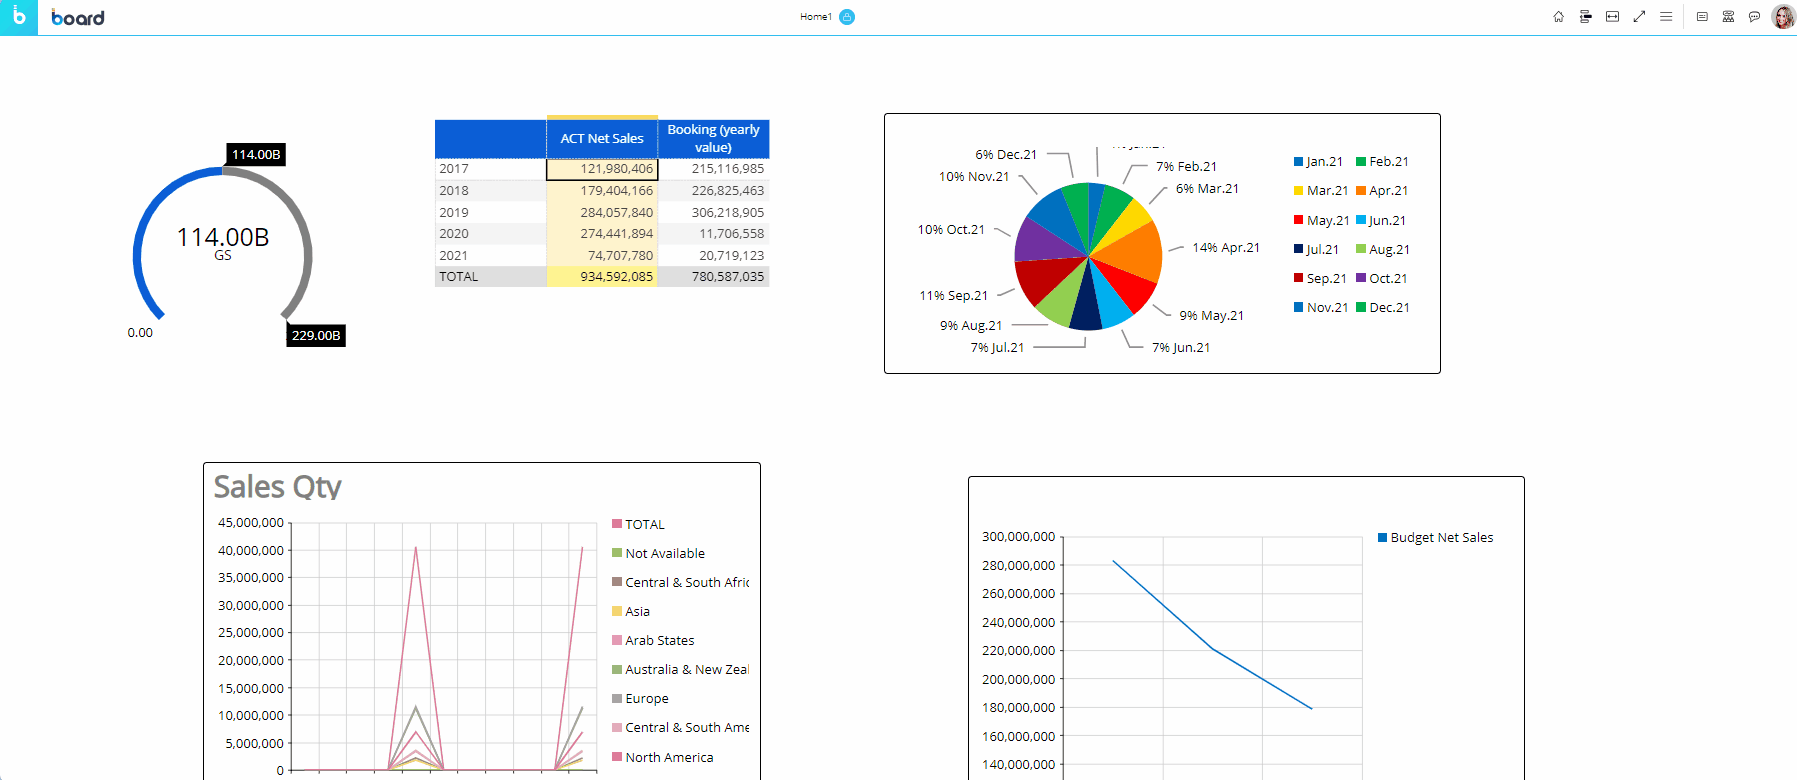
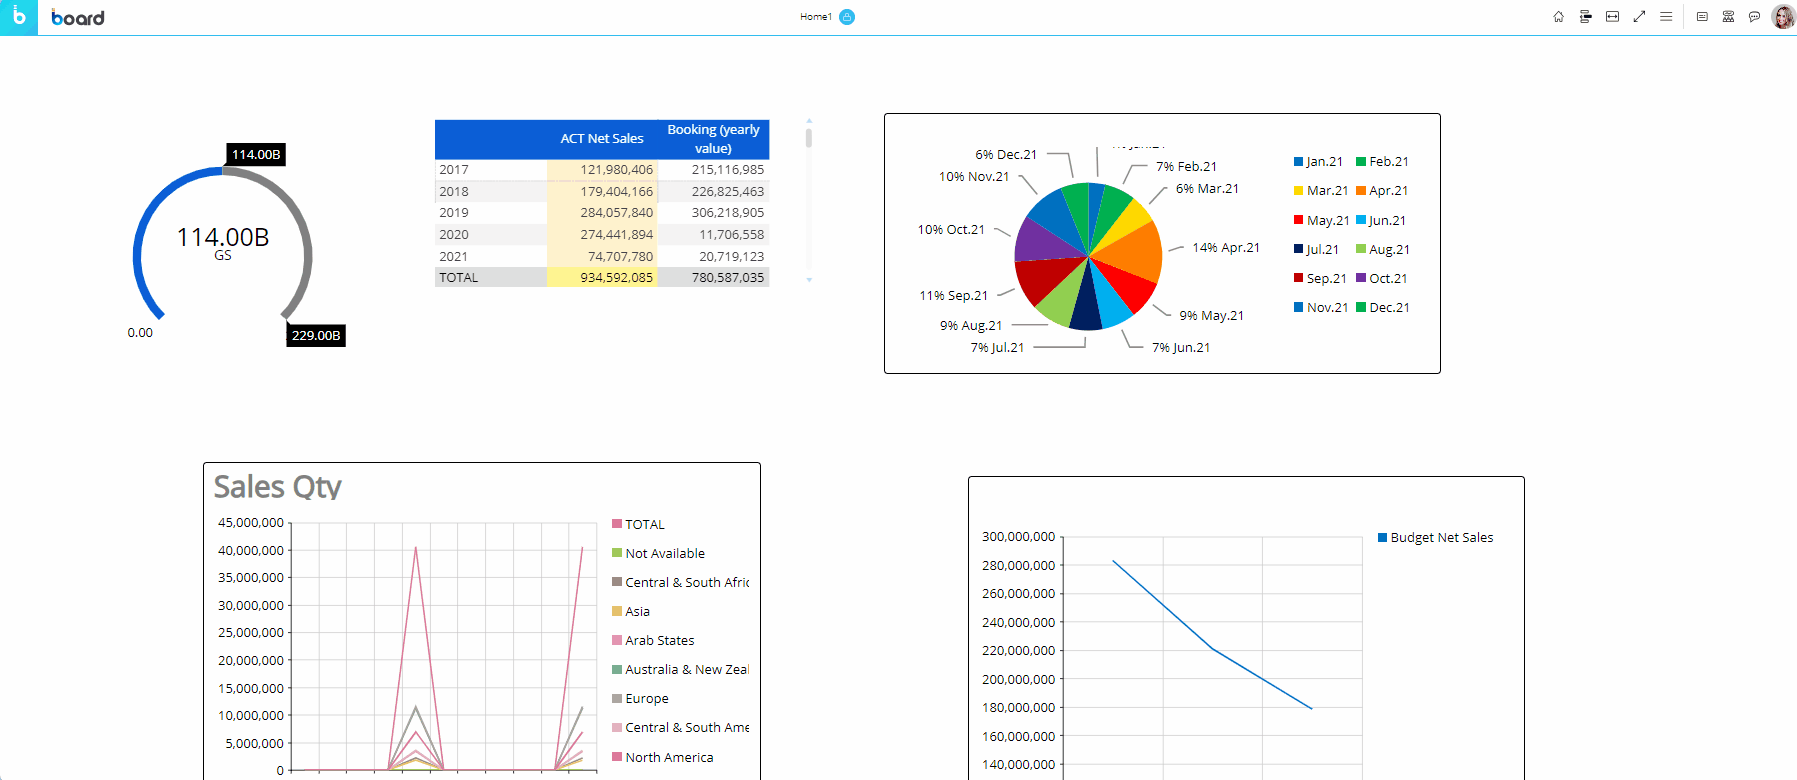
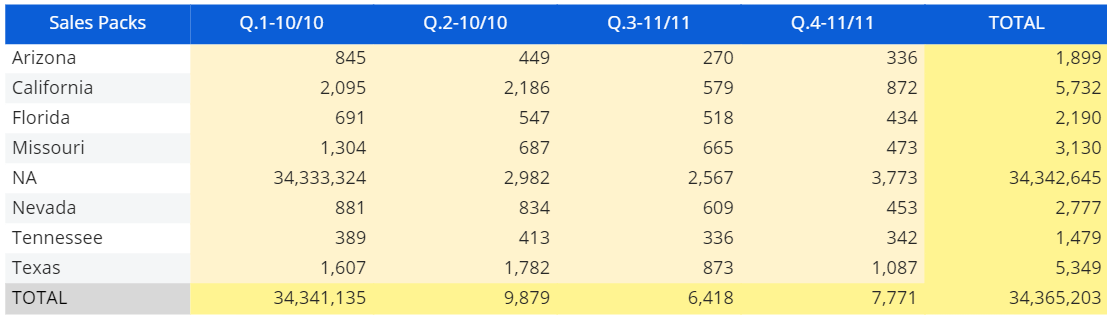
Show Chart data
This feature is only available for Cartesian, Pie, and Radar charts. Show Chart data allows you to view chart data in the form of a Data View, displayed in a popup window similar to the one used for the Drill Down.
To access the feature, hover over a chart Object in Play or Design Modes and click on the Object toolbar icon  . From the sliding toolbar select the "Show chart data" icon
 ![]() to open the dedicated popup window: the Data View displayed in it will show data from the same Layout query used to plot the chart.
to open the dedicated popup window: the Data View displayed in it will show data from the same Layout query used to plot the chart.
The Data View displayed in the popup window supports all classic Data View features, such as drills, data entry actions, export data functions, Nexel, and so on.
The Layout editor cannot be accessed from the popup window.
The Object toolbar
When you hover over a chart, the Object toolbar icon  appears in the top left corner. Click on it to reveal the Object toolbar as a sliding toolbar. You can fully expand it by clicking on the vertical three-dot icon
  on the right.
The Object toolbar includes the following common icons by default (unless otherwise configured):
The Layout icon
 . Opens the Layout editor.
Export data to Excel
 . Exports data in a MS Excel Worksheet as a flattened table.
Export PDF
 . Export the chart as as a PDF file.
Export screenshot .png
 . Takes a screenshot of the chart and saves it as a .png file.
Comment icon
 . Displays any comment attached to the chart (if any). Depending on the comment configuration, the icon displayed can be a balloon icon, a question mark icon or an alert icon.
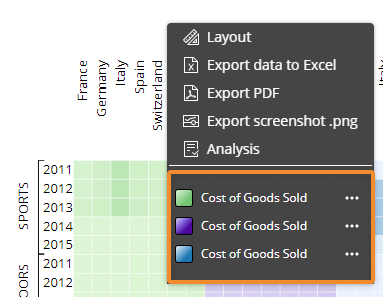
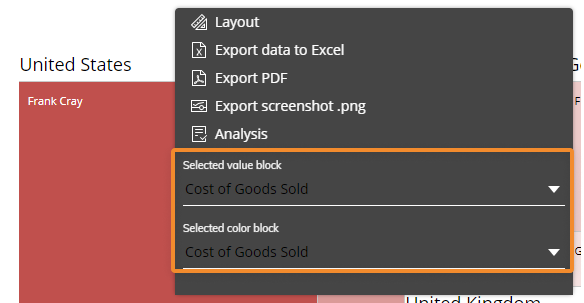
Additional options in the Object toolbar exclusively for the Heatmap and Treemap are:
An additional area displays the Data Blocks in the Layout configuration.
Heatmap. The Planners can change the colors of the Blocks configured in the Heatmap Layout.
Treemap. The Planners can change the Blocks configured in the Layout as the "Selected value Block" and the "Selected Color Block"
Option in the Object toolbar exclusively for the Cartesian, Pie, and Bubble chart:
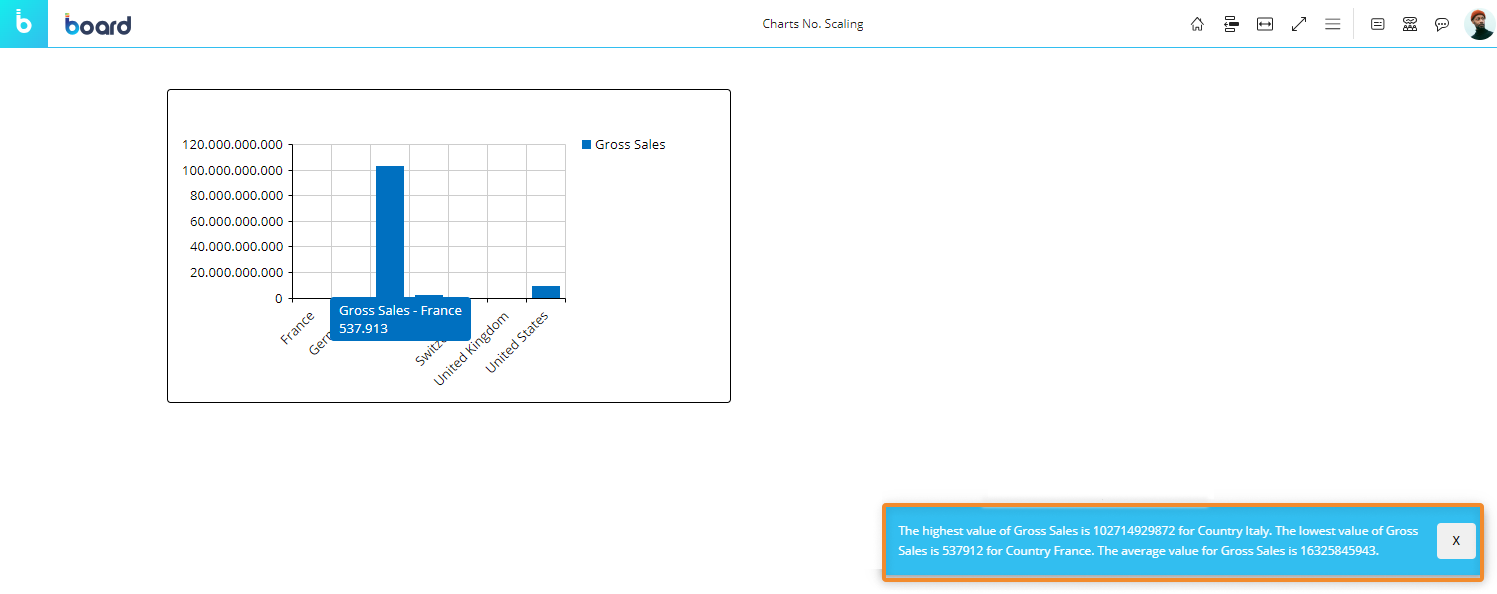
Analysis icon
 . Activates the automatic analysis using Board's Cognitive space technology: this feature generates an audio and textual description of your chart.
Additional options in the Object toolbar exclusively for the Cartesian, Radar, and Pie chart:
Show chart data. Shows chart data in the form of a Data View, displayed in a popup window, as explained above.
Data. Allows you to select all or select individual columns (Data Blocks) of the Layout associated with the chart (deselected Blocks will be hidden from view).
Number scaling
 . Displays large numbers in a shortened format with one decimal place, adding a "K" for thousands, "M" for millions or "B" for billions. If enabled in Design Mode, when the user hovers over the property, a side menu opens with the following options: Disabled, Automatic (in which the numbers are automatically displayed with only one decimal digit), Thousands (K), Millions (M), or Billions (B).
The number of decimal digits displayed for Thousands (K), Millions (M), or Billions (B) reflects the configuration made in Block settings of the Layout Editor, in the "Digits" area under the "Main options" submenu. Changes applied to the number scaling is kept if the Screen is saved as a Slide in a Presentation or using the My Screen View feature.
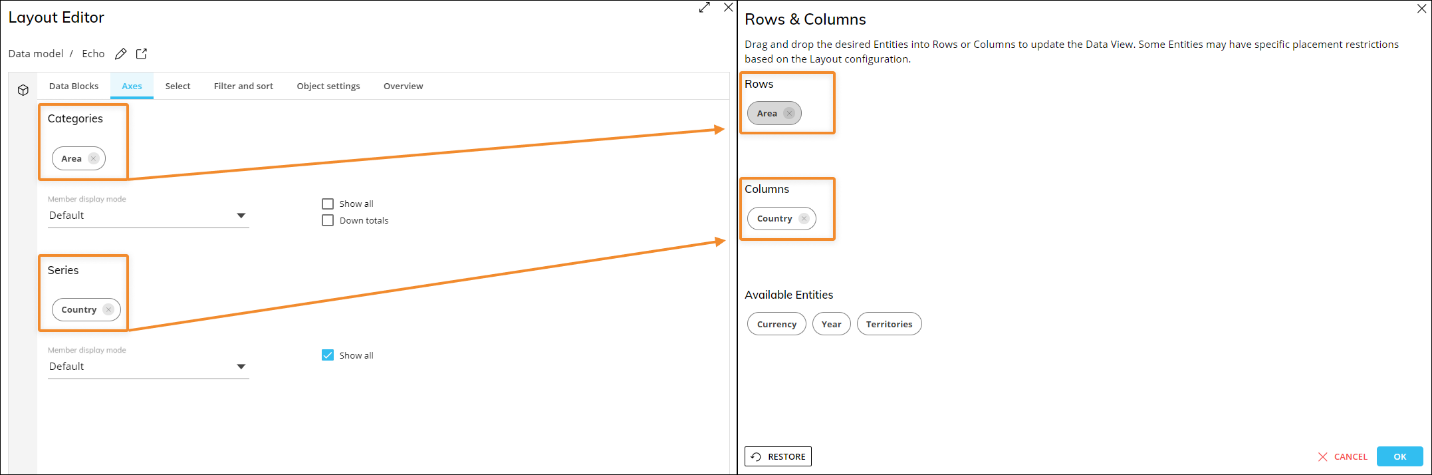
Rows & columns. Allows you to add/remove Entities set by row or by column, configured in the Quick Layout of the Layout Editor.
For Cartesian, Radar, and Pie Charts, Entities are dimensioned by "Categories" and "Series" in the Axes area, which is why it should be noted that in the Quick Layout area of the Layout and in "Rows & Columns" where the Planners can use the Quick Layout, the terms "By Row" and "By Column" are still used: Categories = By Row Series = By Column