This topic describes how to use the Procedure debugger and its specific properties.
The Procedure designer offers various features to support tracing and debugging of Procedures.
You can perform the following tasks in the Procedure "Edit" window:
Add breakpoints that stop the execution of a Procedure at a given step.
Check the Watch window that opens automatically when you run a Procedure with breakpoints: the Watch window allows you to view the active selection and Pagers at that point of the Procedure.
Run a Layout to view the content of a Cube at that point of the Procedure (from the Watch window).
Resume the execution of the Procedure either step by step or to the next breakpoint with the "CONTINUE" and "NEXT" buttons, respectively (from the Watch window).
Using breakpoints
To set a breakpoint, click on the red dot icon next to the step where the Procedure should stop. This can be done in both the Procedure configuration panel under "Steps" and in the Procedure editor window and will automatically save.
If a Procedure contains breakpoints, they will also be visible in the Procedure configuration panel under "Steps".
To manually trigger the execution of a Procedure, select it in the Procedures home page and click the "RUN" button above the table.
When the Procedure stops at the first breakpoint, the Watch window will automatically open as shown in the example below.
 The step at which the Procedure is stopped is not executed when the Watch window opens and is highlighted in light red.
In the Watch window you can easily open the Procedure by clicking the open window icon (  ) to the left of the first table.
At the bottom of the Watch window, you can also:
View the currently active selection in the "Current Select" tab by clicking the "Select" icon (
 ).
).View the content of a Cube in the "Inspect data" tab by clicking the "Add watch" icon (
 ).
).View the Pagers that are currently active on the Screen where the Procedure has been triggered in the "Active Pagers" tab.
View more details about the API request under the "Rest API" tab by clicking the "Test Call" button.
In the case of paginated calls, only the first request will be sent from the "Test Call" dialog. Subsequent pages can be reached by manually adding the corresponding paging parameter values to the request. All dynamic elements (Layout definitions, Substitution Formulas, Data Pickers) are evaluated in the context of the Procedure before sending the test call from the "Test call" dialog.
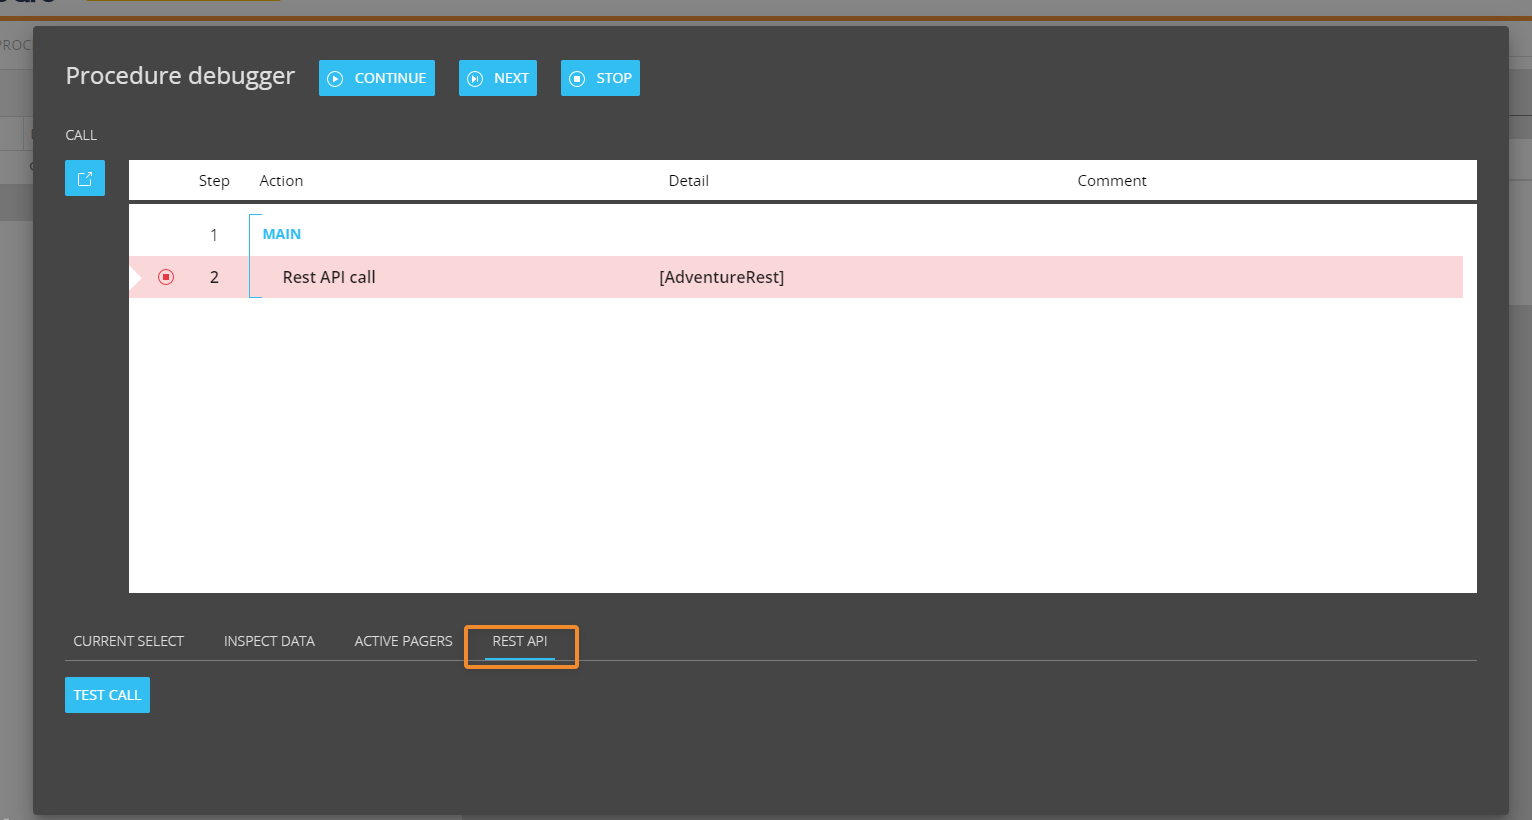
Once you are done with the review, you can resume the execution of the Procedure from the Watch window either step by step or to the next breakpoint with the "CONTINUE" and "NEXT" buttons, respectively. The "STOP" button stops the execution of the Procedure and closes the Watch window.