The Gantt chart Object is commonly used in project management and shows activities, tasks, or events displayed along a timeline. It is useful for tracking project schedules, as it is able to break down the activities on a chart and to display several information about these activities and the whole project.
On the left of the chart is a list of the activities that can also be organized in groups, and along the top is a time scale. Each bar on the right represents an activity, while its position and length indicate the start date, duration, and end date of such activity.
Example
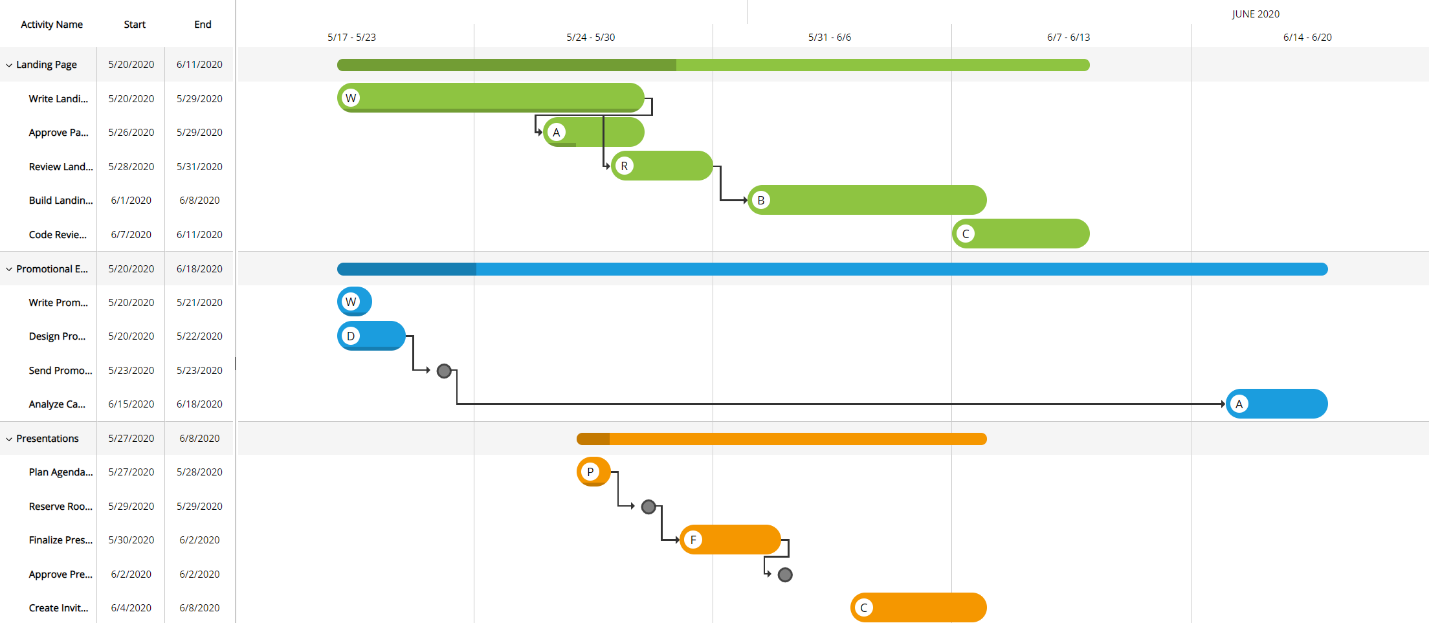
The following image shows a Gantt chart of a project with its main stages (thin bars), the tasks that need to be done (wide bars), their progress, and how they depend on each other. All this is displayed along a timeline, represented by the time scale above.