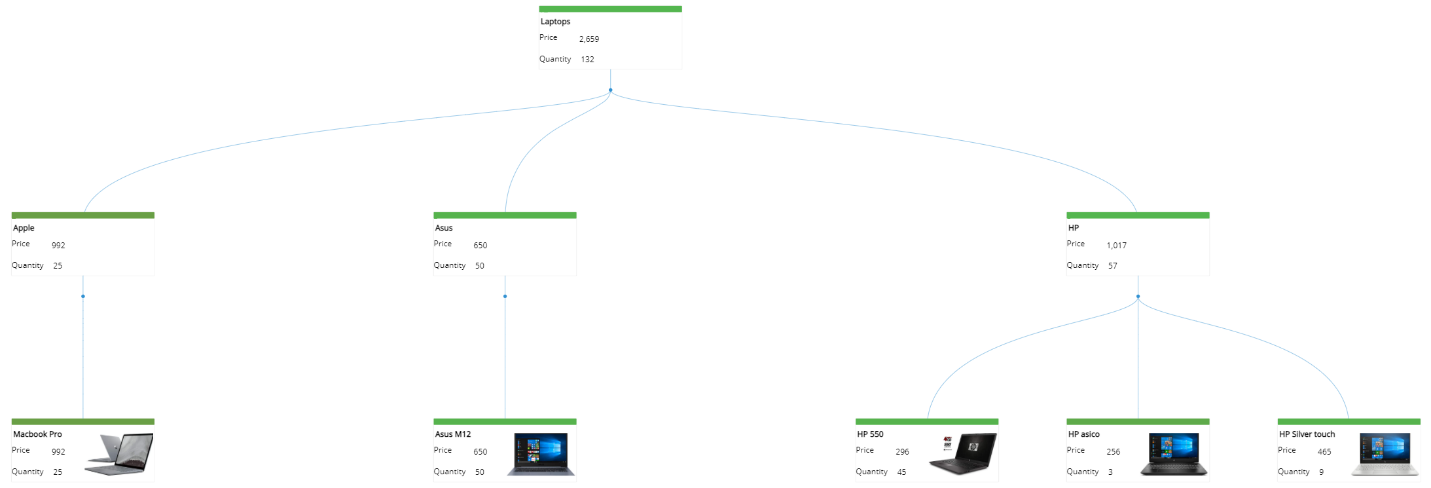
The Tree Object (also called Tree Node Chart) is a graphic diagram that shows how items are related to one another: typically, it is used for representing a hierarchical structure in a tree-like form.
Examples
The following image shows a simple stock tree with 3 hierarchical nodes. Each node is displayed as a card with additional information about a specific product category, brands, names and other KPIs.

The following image shows a typical organizational chart showing the structure of a sales department. The Tree displayed below has been created using an unbalanced hierarchy.
