Overview
Starting in version 14.3, Board introduces the Board Signals add-on, enabling users to access curated Economic indicators. These indicators can be added to Screen Objects as Cubes to:
Enhance forecast accuracy
Identify emerging trends
Support data-driven decision-making
Setup Requirements: The Economic indicators add-on must be enabled during instance configuration or version upgrades. An API connection must be established in Foresight.
Step-by-Step: Adding Economic indicators to Cubes
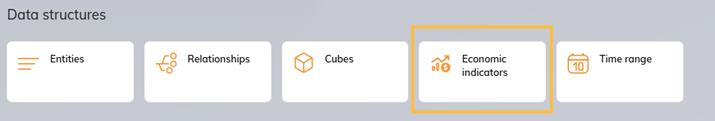
Accessing the Data Model
Once enabled, a new Economic indicators data structure will be available in your Data Model.
Viewing Industry Properties
Once you click on the Economic indicators data structure, a new screen will appear. This will be populated with the Signals industry activated in your instance, and includes the following properties:
Industry: The name of the Signals industry (e.g. Retail, Manufacturing).
Number of Economic Indicators: The total indicators available for that industry.
Description: The region associated with the industry (e.g. United States, European Union).
.png)
Viewing and Configuring Indicators
Clicking on an industry opens a modal listing the Economic indicators within that segment. Each indicator includes the following properties:
Name: A clean, user-friendly name.
Active: A bubble (blue when active); activating this will create a Cube, deactivating it will remove the Cube. See Indicator Activation Behavior.
Technical Name: The Foresight platform's internal name.
Description: A short explanation of the indicator.
.png)
Click on an indicator to access two tabs:
Configuration tab: Activate/deactivate the indicator and/or optionally rename the indicator.
.png)
Details tab: View additional details on the indicator, such as a time-series chart, frequency, data type, units, seasonality, provider ID, number of historical and forecast points, and indicator tags.
.png)
Indicator Activation Behavior
When an indicator is activated:
The Active status is visually confirmed (the row no longer appears greyed out).
.png)
A Cube is automatically created in the Data Model. The Cube is grouped under the corresponding Industry name.
.png)
You can now add the indicator directly to Screen Objects as a Cube using the Layout Editor.
.png)