This topic describes how to add a Data View Object to a Screen or a Container and its specific properties.
To create a Data View, you need to access a Screen in Design Mode.
Once you're in the Screen editing page, drag and drop the Data View from the Screen Objects subpage in the left panel onto your Screen or Container.
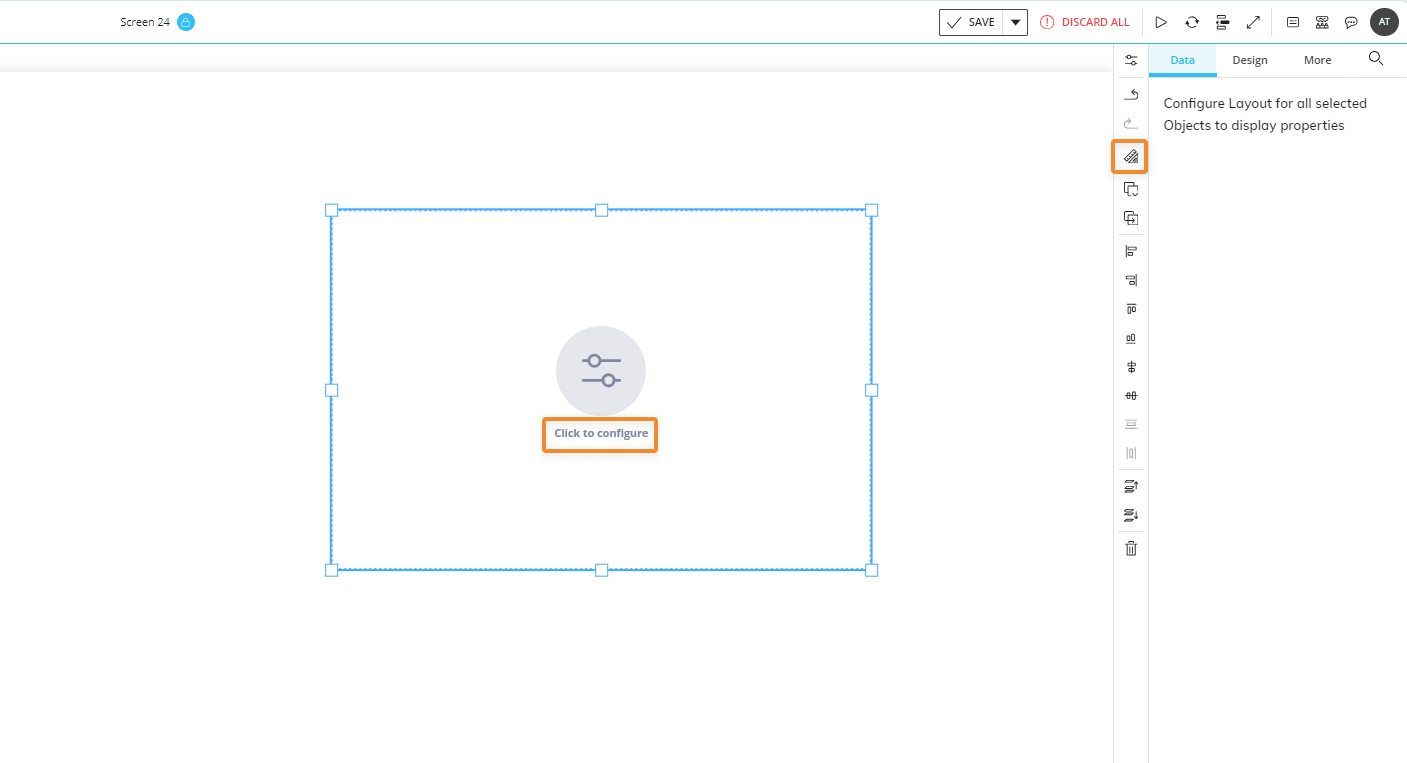
When you create a Data View, it is initially empty. The next step is to configure a Layout that will define the data to be displayed in the Data View.
To configure a Data View Layout, click on the area saying "Click to configure" or select the Data View and click the "Configure Layout" icon  in the Properties toolbar located vertically along the right Screen panel in the Capsule workspace.
See The Layout Object, Configure a Layout, and About Data Blocks of a Layout for more details on the Layout Object.
The Data View, just like every other Object, can be moved, resized, duplicated via copy/paste, and easily aligned with other Objects on the Screen.
See Configure Screen Objects for more details.
Data View Layout
The Layout editor for the Data View Object offers all of the possible configuration features, as the Layout Object has been created and developed specifically for the Data View.
See The Layout Object, Configure a Layout, and About Data Blocks of a Layout for more details on the Layout Object. Read about the copy/paste limitations between Data View and Flex Grid.
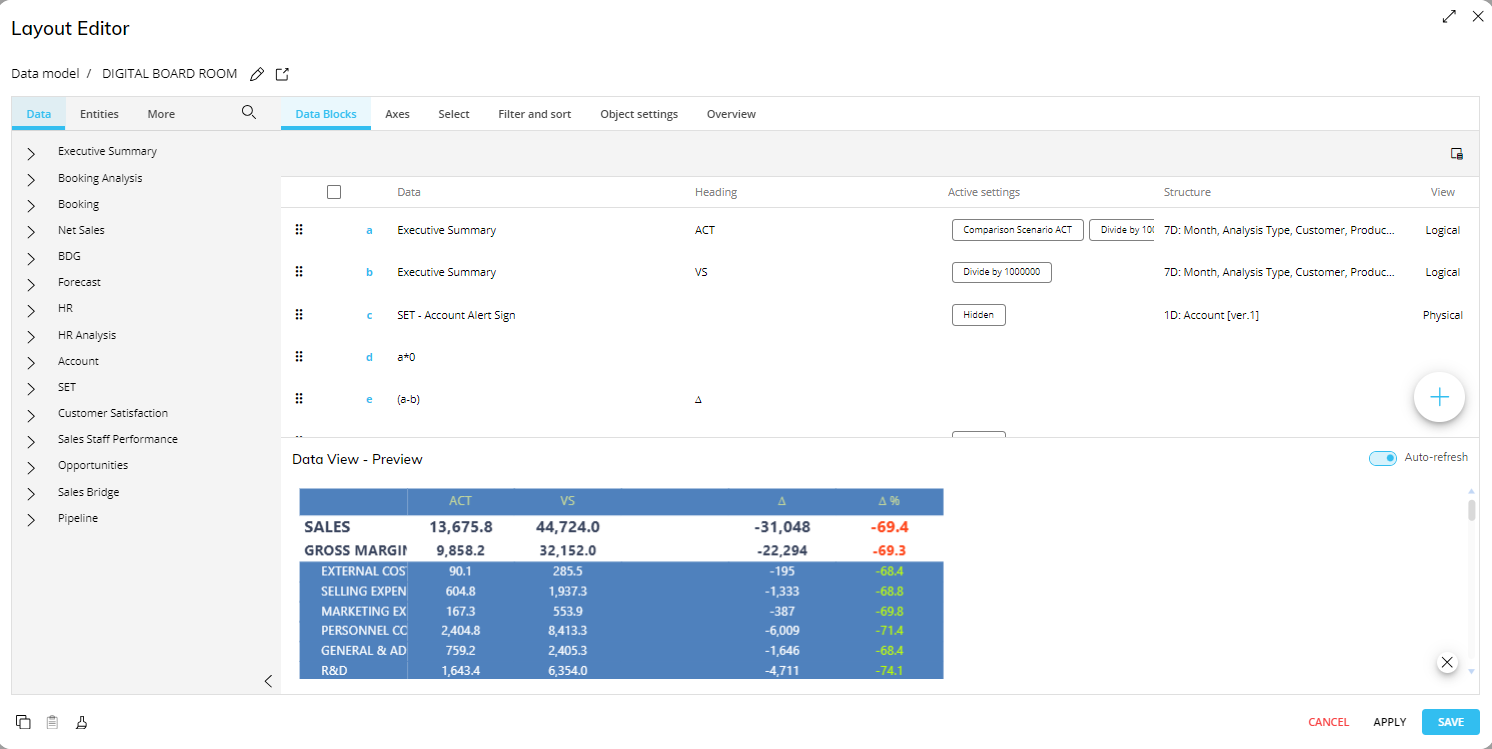
The Data Blocks Area
The Data Area of a Data View Object Layout supports all kinds of Data Blocks (Cubes, Algorithms, Entities, etc.) and all Data Block settings.
Axes area
The Data View Object supports as many Entities By Row and By Column as desired. However, if you plan on displaying data with a large amount of data and many Entities By Row and Column, you might consider using a Flex Grid Object.
Please bear in mind that adding a large number of Entities to the Axes area will greatly increase the number of returned values: as a result, the loading time of the Data View may slow down considerably.
When you add multiple Entities By Row, Board automatically detects the appropriate grouping: the most-nested Entity in a Relationship is arranged in the rightmost position in the "By Row" field. You can rearrange the Entities order in each of the two fields only if those Entities are unrelated. To do so, drag and drop them in the desired position.
The Object preview pane
By default, each Block set in the Data Area is displayed as a column of the Data View in the Object preview pane. The column is displayed for all Entities set by Column in the Axis area, as shown in the following image.
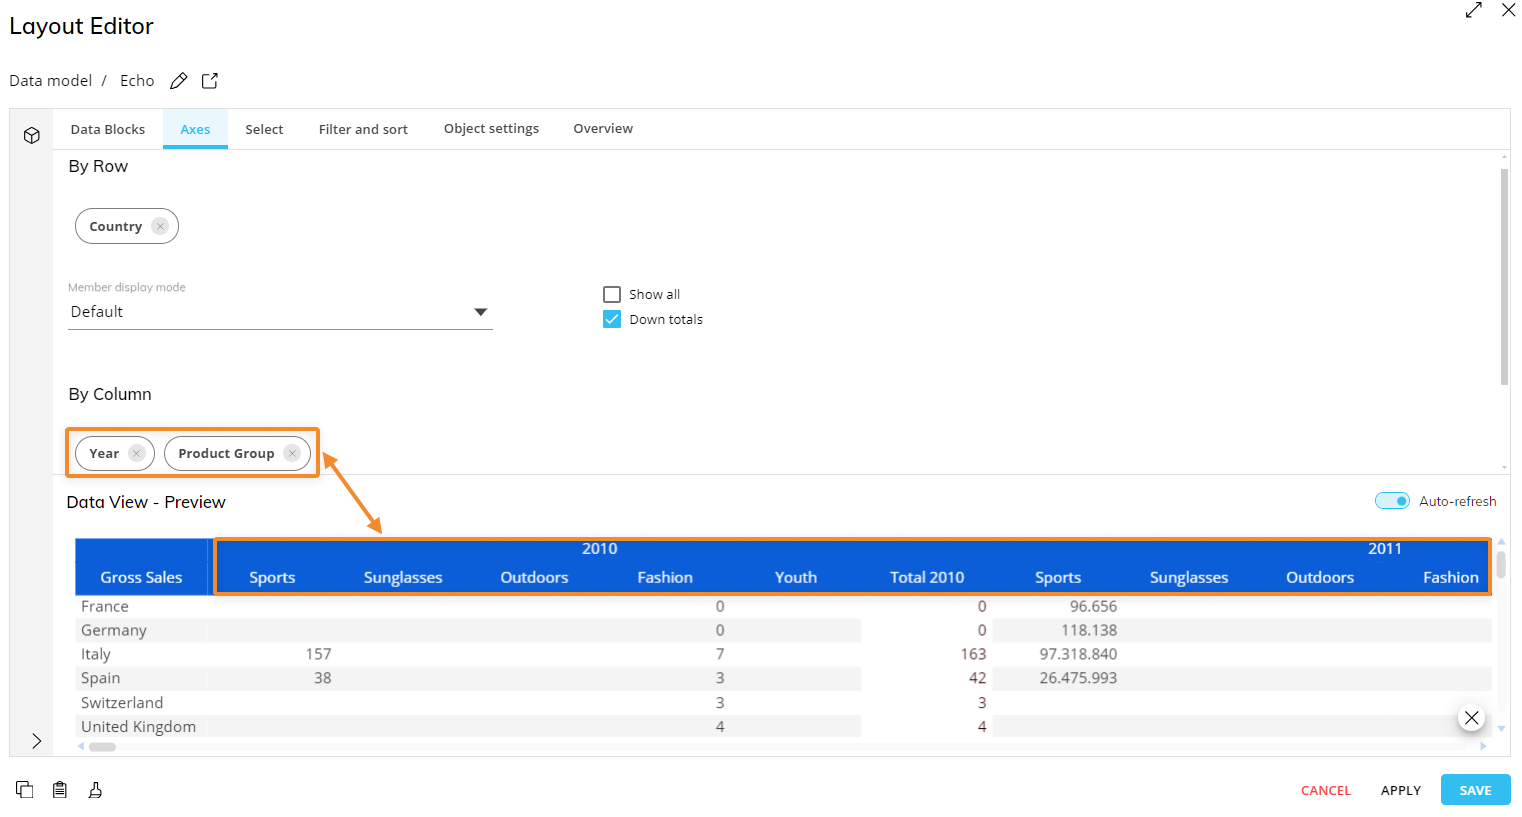
The Data View in the Object preview pane is interactive: you can sort data by clicking on the table headers, expand/collapse groups, and see any applied Blocks settings in action.
Object settings
In the Layout Editor, under the Object settings subpage, the following options organized by section are available:
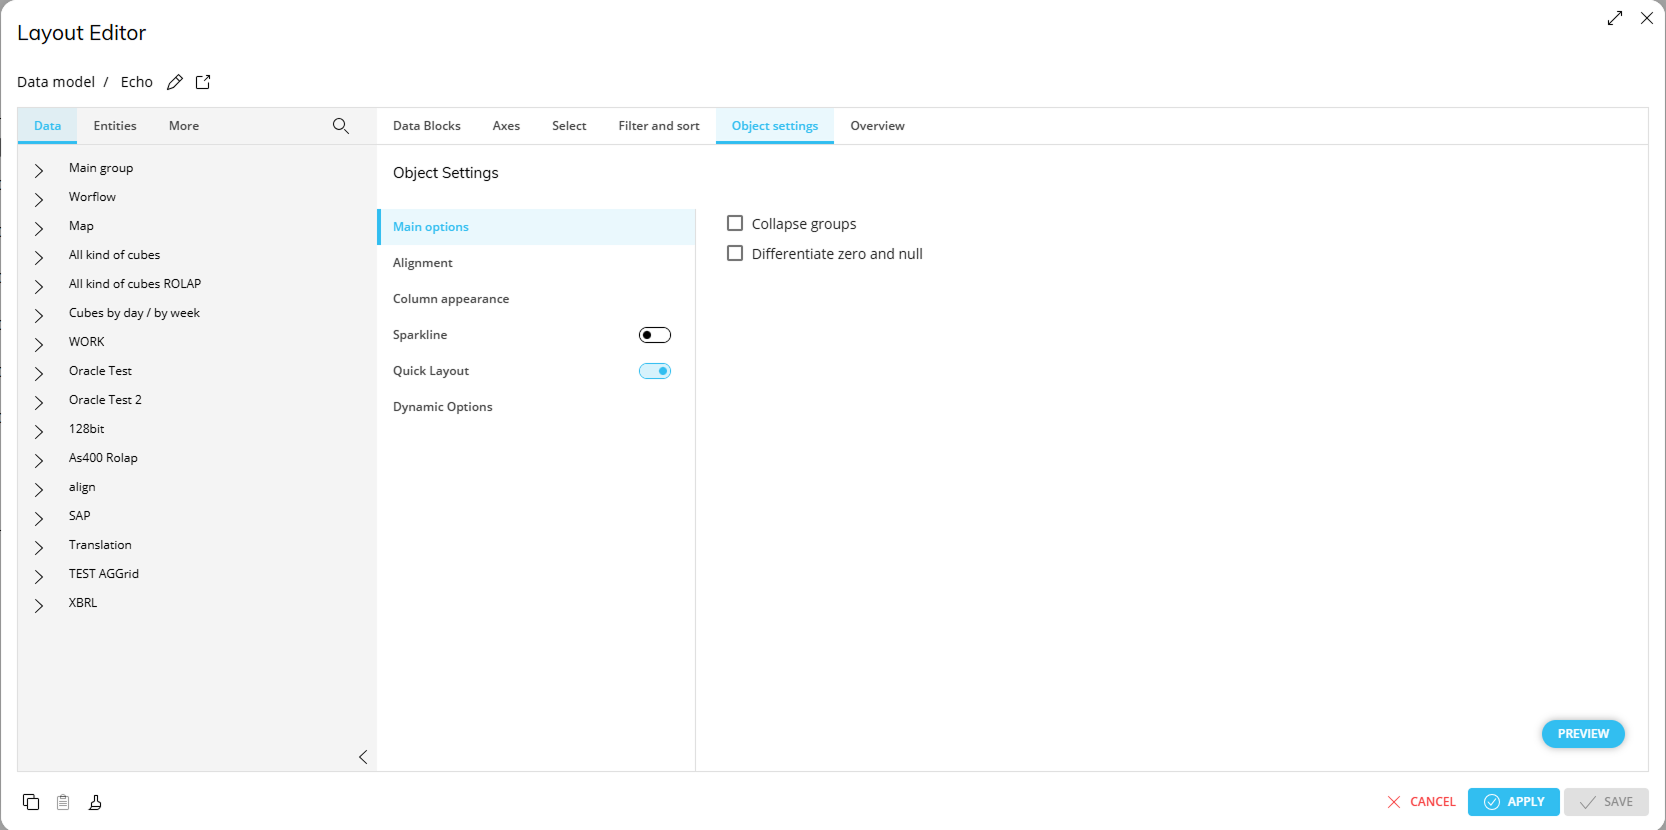
Main options
The "Collapse groups" option, if enabled, shows Entity groups in the Data View collapsed by default.
The "Differentiate zero and null" option, if enabled, makes Board handle 0 and empty values differently when these values are shown in cells or entered with a Data Entry action.
When this option is active, the Data View will show:
An empty cell when no value is entered by the user or when there isn't any value for the corresponding combination of Entities and Data Blocks.
The number 0 when the 0 value is entered by the user or when the value coming from the corresponding combination of Entities and Data Blocks is 0. To save the 0 value entered by the user, the "Hide zeroes" option must be enabled on the Data Blocks in the Layout Editor.
Alignment
The Alignment menu allows you to configure the alignment of totals and/or Blocks. The following dropdown menus are available:
Totals alignment. Choose how you would like to align the totals: on the left, on the right, or in the center.
Blocks alignment. Choose how you would like to align the Blocks' values: horizontally (default) or vertically.
When that "Blocks alignment" option is set to "Vertically", the values of the Layout Blocks are displayed on rows in the Data View, rather than on columns (default setting). This is particularly useful, for example, when you have a report displaying various KPIs in rows (each KPI being a Block of the Layout) and you need to perform write-back operations).
An Entity set by Column is required for vertically-aligned Layouts. Multiple Entities by Column are not supported. You can also add an Entity by Row, if needed. Multiple Entities by Row are not supported on vertical Layouts. The drill feature is not supported on vertically-aligned Layouts. The Nexel feature is not supported on vertically-aligned Layouts.
Column appearance
The Column appearance menu allows you to configure how cells should look.
The following options are available in the dropdown menu for each Data Block of the Layout:
Default
Button
Checkbox
Drill Configuration
You can also click "CONFIGURE TO DRILL" to configure a Drill down, Drill-to-Screen, Drill-Procedure, and Drill Through on one or more Data Blocks. See the following Drill-related articles for more details:
Sparkline
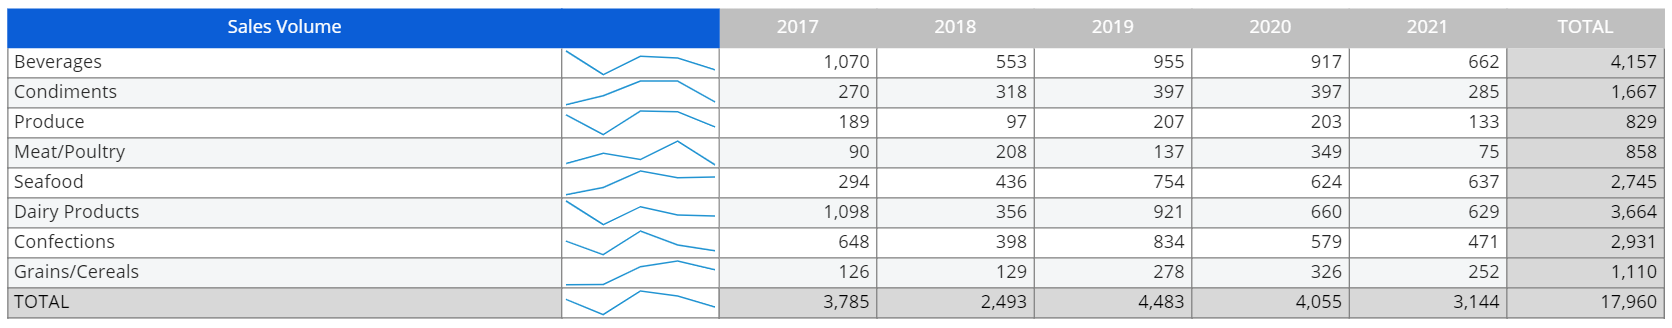
The Sparkline option allows you to include charts that provide a visual representation of data within the Data View.
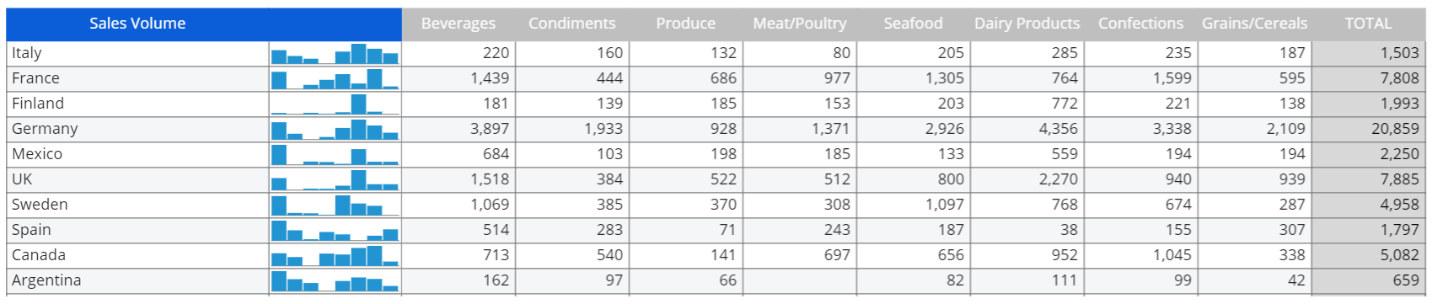
Charts are always displayed after each row header and can be of two different types:
Line chart. The line chart is displayed when a Time Entity is set by Column.
Bar chart. The bar chart is displayed when a non-Time Entity is set by column.
To configure the Sparkline option, proceed as follows:
Open the Layout Editor and open the "Object settings" tab and click on "Sparkline" from the menu.
Enable the toggle next to the Sparkline title and select one or more Blocks you want the chart to be based on from the dropdown menu.
The chart is immediately visible in the Object preview.
To display a meaningful chart, the Sparkline option requires at least one Entity set By Row and one Entity set By Column.
For more options and settings, please see Formatting a Data View and About Objects.
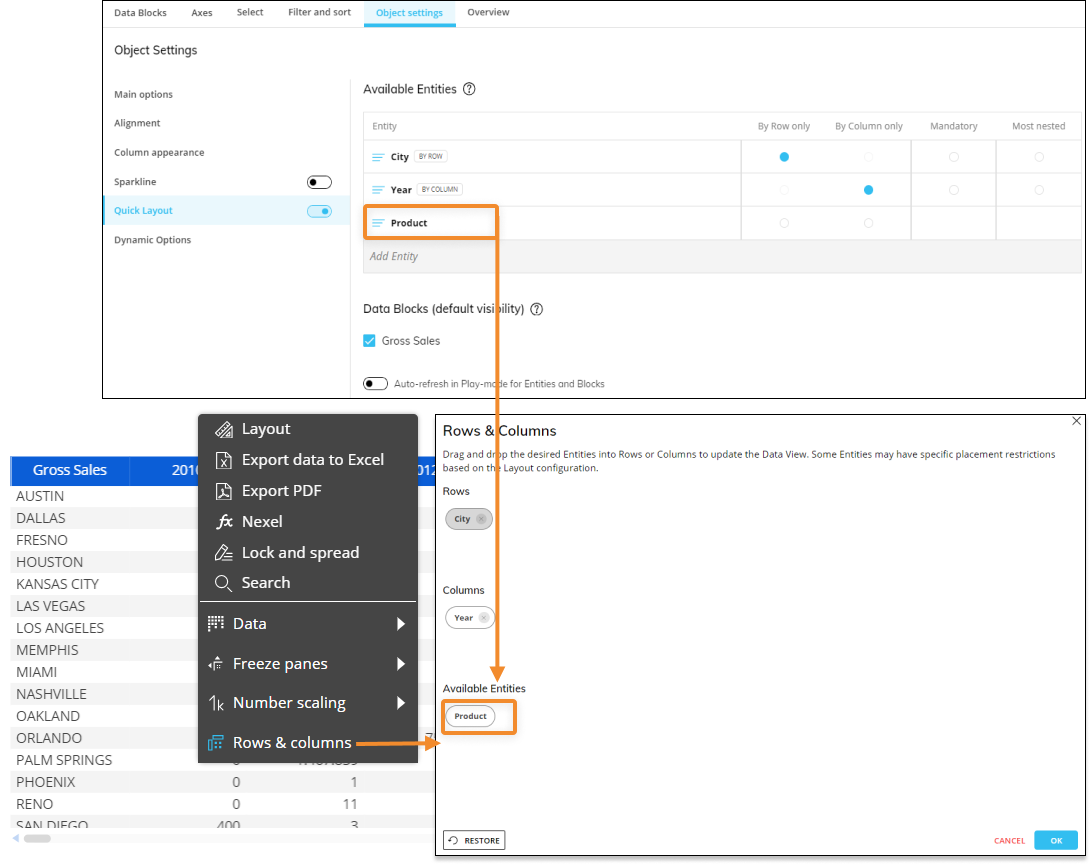
Quick Layout
The Quick Layout allows you to configure restrictions and permissions of the Entities chosen in a Layout for the end user to add by Row or Column or remove altogether in Play Mode. This feature is particularly useful when the full Layout editor is disabled in Play Mode, but you still want to allow users to see data for different Entities in different configurations. Read more about the Quick Layout feature.
Quick Layout is enabled by default.
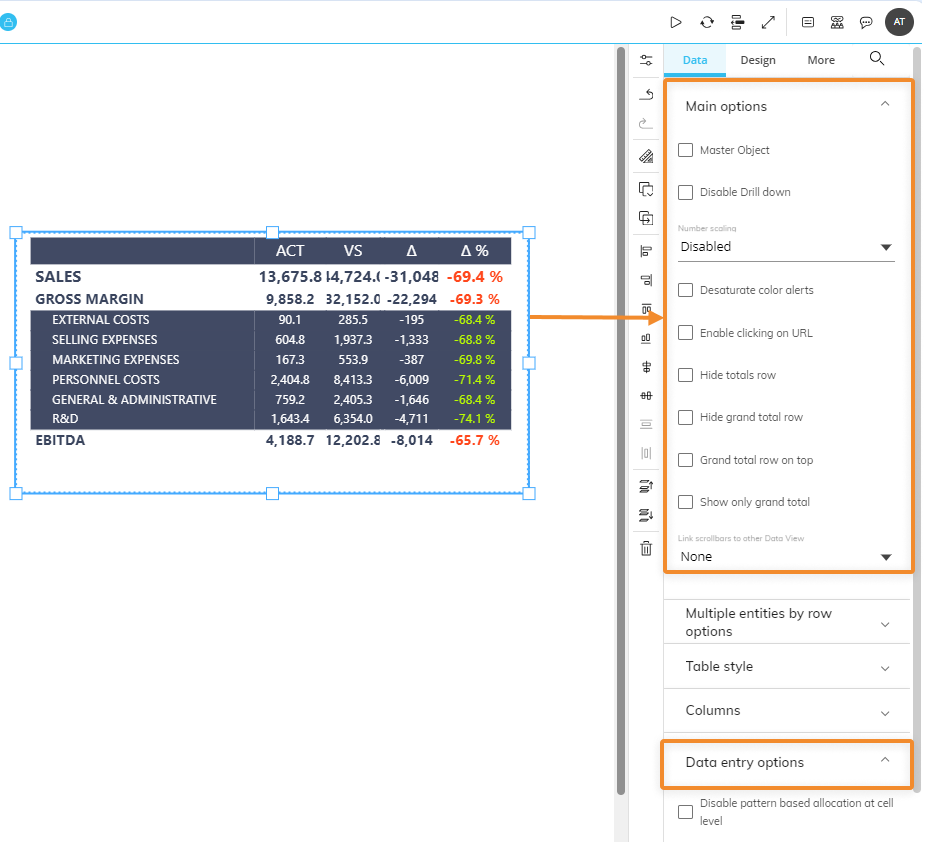
Data View Properties
The main Data View properties are available from the Object Properties panel to the right of the Screen editing page under "Data" once the Data View is selected and it's associated with a Layout.
They are the following:
Data View Main Options
Master Object. If enabled, clicking on a row header (i.e. the Entity members set by row) will update the data displayed by all other Objects on the Screen in order to show only the data relating to the clicked header. The Master object result is similar to applying a Screen Selection.
Disable Drill down. Disables the drill-down functionality on the Data View both in Design Mode and Play Mode.
Numbers scaling. Displays whether to view large numbers in a shortened format with one decimal place, adding a "K" for thousands, "M" for millions or "B" for billions. The Developer can choose to enable it so the user can choose between Disabled, Automatic, Thousands (K), Millions (M), or Billions (B) in Play Mode, or Developers can choose a fixed option. For example, 12,543,000 is automatically displayed as 12.5 M.
The number of decimal digits displayed for Thousands (K), Millions (M), or Billions (B) reflects the configuration made in Block properties panel of the Layout Editor, in the "Digits" property under the "VIEW" menu. The "Ignore number scaling" property (checkbox) can be enabled from the "Block format" configuration page under "Options": this allows the Data View to ignore the "Number scaling" property in case Entities or Algorithm Blocks show values other than integers, such as percentages.
Desaturate Color Alerts (enabled by default). Displays different shades of colors configured in the Color alert option of the Layout based on actual cell values. If disabled, only the colors configured in the Color alert option are displayed. This option applies to Figures, Blocks and Blocks only alert formats.
Enable Clicking on URL (enabled by default). Makes URLs displayed in a Data View clickable. Clicking on a URL opens a new tab and displays the linked web page.
Hide Totals Row. Hides the total rows.
Hide Grand Total Row. Hides the grand total row.
Grand Total Row on Top. Displays the Grand Total row on top.
Show Only Grand Total. Displays only the Grand Total row and hides all other rows of the Data View.
Link scrollbars to other Data View. This option "links" the scrollbars of two Data Views so that when you scroll on one, the other Data View scrolls as well. Although you can only link one Data View scrollbar to another, you can link multiple combinations of Data View scrollbars together, like so DV1→DV2, DV2→DV3, and DV3→DV1, so that all or multiple Data Views on the Screen link together. To choose the Data View to link to, select it in the dropdown menu. The option requires the configuration of the Layout axis area on both Data Views (By Row and/or By Column fields) to be exactly the same.
Remove the Summary algo labels from Total rows. This option removes the label that appears in the row Totals based on the Summary algorithm configured in the Data Block settings.
Data View Data Entry options
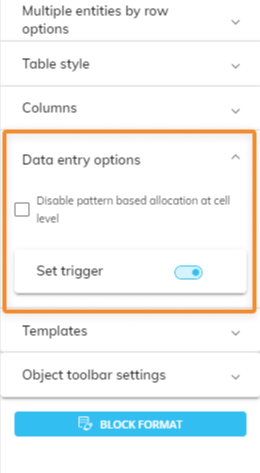
Disable pattern based allocation at cell level. Disables the pattern-based allocation option on a Data View with Data Entry enabled. If enabled, you will need to add a Button to your Screen and configure it in order to save all pattern-based Data Entry actions. In this case, all entered values will be saved using the Button.
Read more about the Data Entry option and pattern-based allocation.Set trigger. Allows to select a Board Procedure which will be automatically triggered immediately after Data Entry is performed on the Data View. This feature is useful when you want to automatically update calculations on a Cube that depends on another Cube as users enter data in it: for example, you can use it to recalculate the Forecast Amount Cube as the Forecast Quantity changes.
Disable screen refresh after execution. Disables the automatic refresh of Screen Objects after the triggered Procedure has finished running (in this case, be sure to include a Refresh Screen action in the triggered procedure in order to always show updated data).
Execute procedure for active selection. If enabled, triggers the associated Procedure only once as soon as new values are saved and only on the active Selection on Screen, instead of running it one time for every updated value. The new option is disabled by default.
This new implementation allows Developers to automatically trigger workflow and calculation Procedures when new values are saved, without the need to add other Objects on the Screen (e.g. Buttons) to manually trigger said Procedures.
The "Set trigger" option only works on a Data View where data entry is enabled on one or more columns. The execution of the Procedure affects only rows containing data that has been modified and saved.
Data Entry actions on vertically-aligned Layouts
You can perform data entry actions on vertically-aligned Layouts just as you would with horizontally aligned ones: double-click on a cell and type the desired value.
See Data entry on Cubes (Cube write-back) for more details.
Vertically-aligned Layouts are Layouts that have the "Blocks Alignment" option under the Alignment menu of the Object Settings section in the Layout editor set to "Vertically", as shown below.

When that option is set to "Vertically", the values of the Layout Blocks are displayed on rows in the Data View, rather than on columns (default setting). This is particularly useful, for example, when you have a report displaying various KPIs in rows (each KPI being a Block of the Layout) and you need to perform write-back operations.
An Entity set by Column is required for vertically-aligned Layouts. Multiple Entities by Column are not supported.
You can also add an Entity by Row, if needed. Multiple Entities by Row are not supported on vertically-aligned Layouts.
The drill feature is not supported on vertically-aligned Layouts.
The Nexel feature is not supported on vertically-aligned Layouts.
The Data entry feature on vertically-aligned Layouts also supports Unbalanced hierarchies and the Lock and Spread feature.
Supported Block types
Data entry on vertically-aligned Layouts can be enabled on Blocks populated with:
A Cube. In this case, a Data Entry action saves a value (numerical, text, a date) or a file in the specified Cube.
BLOB Cubes are not supported in vertically-aligned Layouts.
An Algorithm. In this case, a Data Entry action saves a value to a Cube by reversing the formula of the calculated Block (using the "Reverse algorithm" option).
Requirements and known limitations to enable Data Entry on vertically-aligned Layouts are similar to those mentioned above except for the following additional conditions:
An Entity must be set in the "By Column" field in the Axes area. Multiple Entities by column are not supported.
BLOB Cubes are not supported in vertically-aligned Layouts.
The following Block settings are not supported if the Data Entry option is enabled:
Time functions (such as Previous Year, Yearly Cumulated Valued, etc.).
The "Refer To" option under the "Block References" menu.
The "Detail By" option.
The "Total By" option.
The aggregation functions.
Data View keyboard shortcuts
In addition to the interactive features, a few keyboard shortcuts are supported by the Data View Object: these shortcuts allow you to work more efficiently, especially with Data Views consisting of a large amount of rows. They are the following:
Home (or Ctrl+left arrow). Go to the first cell of the current row.
End (or Ctrl+right )arrow. Go to the last cell of the current row.
Ctrl+home. Go to the beginning of the Data View (the first cell in the top left corner).
Ctrl+end. Go to the end of the Data View (the last cell in the lower right corner).
Ctrl+up arrow. Go to the first cell of the current column.
Ctrl+down arrow. Go to the last cell of the current column.
Read about interacting with a Data View in Design mode, including how to configure Drills.