This topic describes how to navigate and customize the settings and options of a Heatmap chart Object, which are the following:
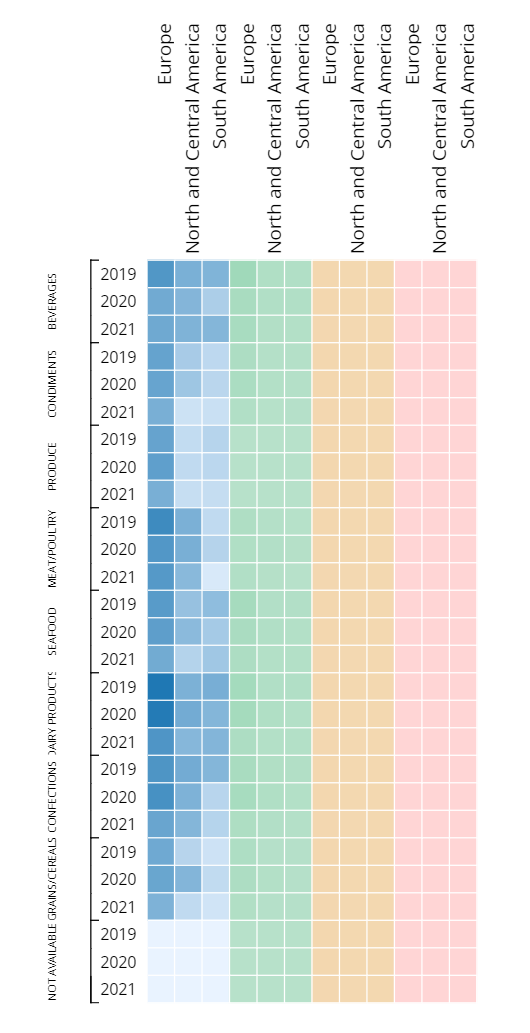
The Heatmap chart is a two-dimensional graphical representation of data where values are encoded in colors, resulting in a helpful and insightful view of information.
Each square in the chart can represent a numerical or logical value that determines the cell color: larger values are associated with darker coloring, while smaller values are associated with lighter coloring.
Heatmap chart: Layout properties
The Layout editor for a Heatmap chart includes a specific menu in order to configure which Block will be plotted in the chart, as displayed in the following image:
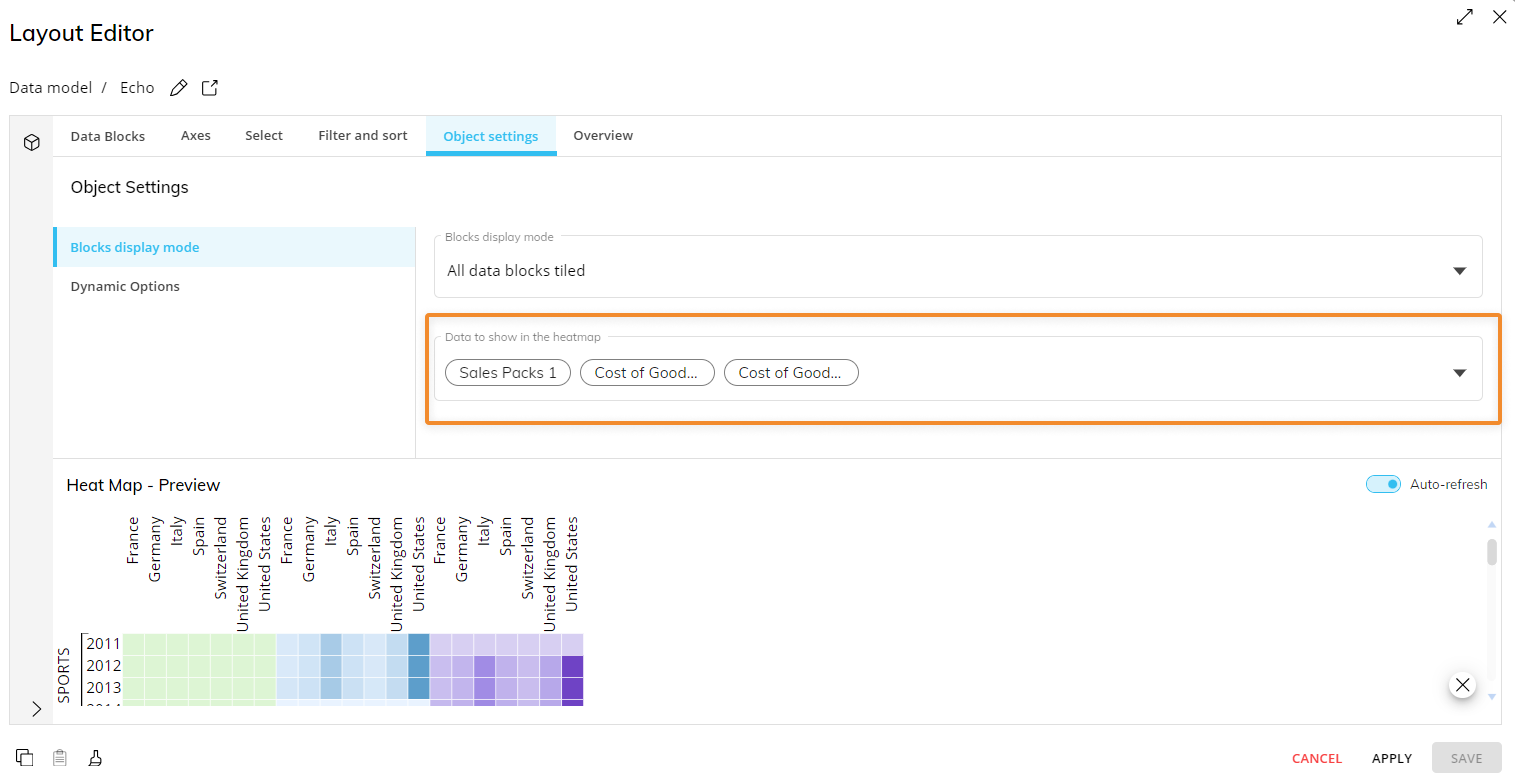
Object settings: Blocks display mode
In Object settings and under the "Blocks display mode" menu, you can select which Blocks you want to include (unselect to exclude) in the chart from the "Data to show in the Heatmap" dropdown menu.
You can add as many Entities as you want in both axes, but the Layout will only consider the most-nested one in the By Column field. If you add multiple Entities in the by Row field, Entity grouping will occur. Blocks hidden using the dedicated option in the Block settings won't be available in the "Data to show in the Heatmap" dropdown menu.
Heatmap chart Object properties
Additional Heatmap chart properties are available from the Object Properties panel to the right of the Screen editing page once the Chart Object is selected and associated with a Layout. They are highlighted in the following image:
Main options of Data properties
Value block. Choose available Blocks to see the Heatmap display data from each individual Block
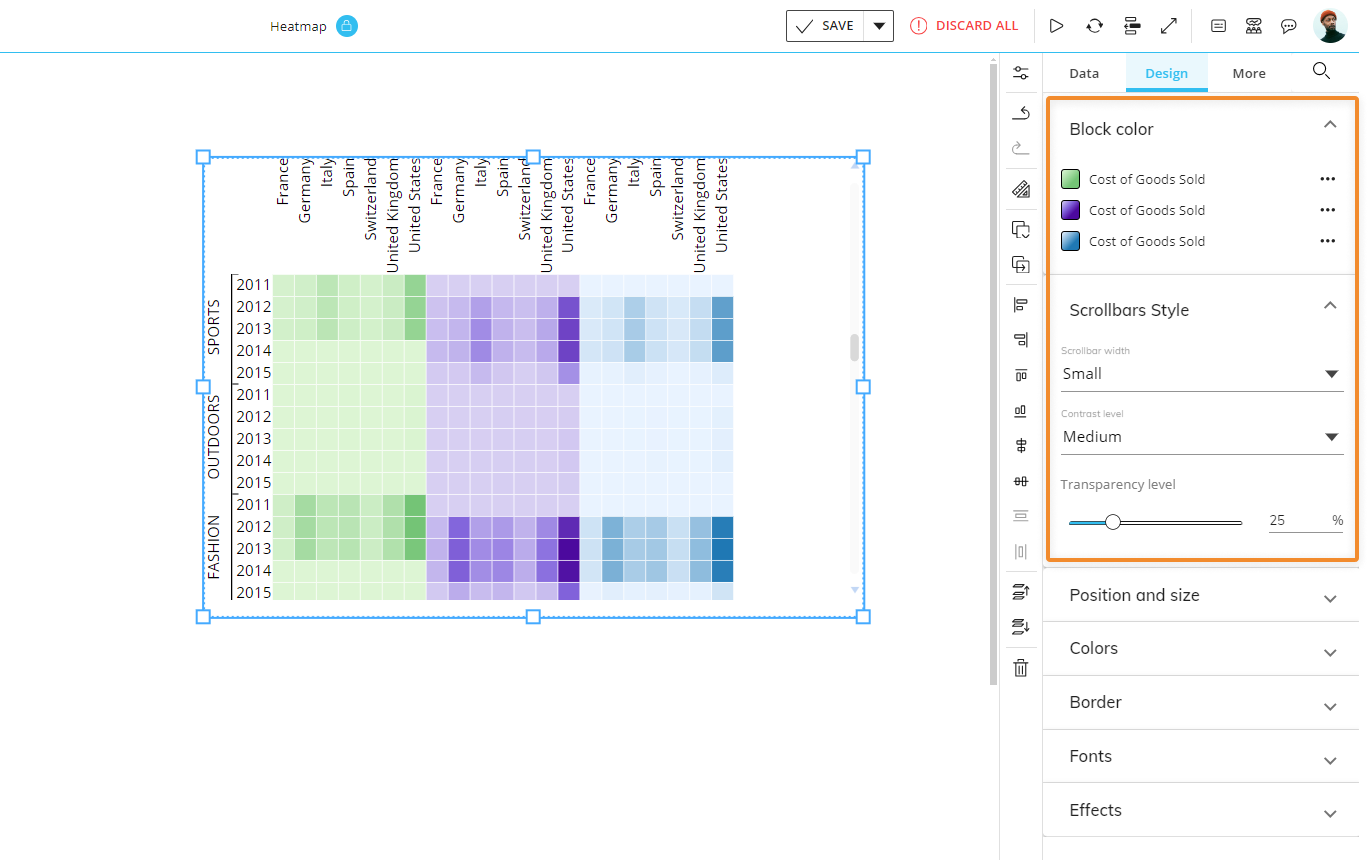
Design properties
From the Design subpage of the Object Properties panel, you can customize the design of the Heatmap. The settings specific to a Heatmap chart are as follows.
Block color
The Block color menu gives you the ability to adjust the color intensity for each Block using the Offset field or by dragging the slider's thumb. Click the three dots to the right of each Block name to open a dialog menu for customization with the following options:
Colors. Choose a color for each Block.
Offset. Use the slider to choose the percentage you'd like to offset the Block color intensity in your chart.
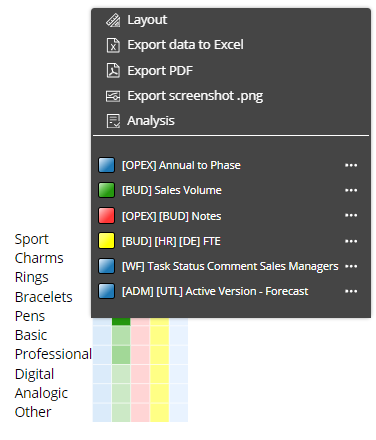
The slider is also available to users in Play Mode, from the sliding toolbar of the chart:
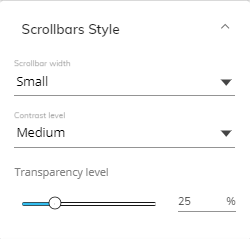
Scrollbars style
Scrollbars style. Here you can customize the scrollbars of a Heatmap. The options for this Object setting are the following:
Scrollbar width. You can choose the width of the scrollbars from the dedicated drop-down list. You can choose one of the following options: Small, Medium, Large.
Contrast level. You can choose the color contrast of the scrollbars from the dedicated drop-down list. You can choose one of the following options: Small, Medium, Large.
Transparency level. You can choose the transparency level of the scrollbars by sliding the transparency level slider or manually entering a transparency level percentage number in the dedicated field.
These settings are also included in the properties that can be copied and pasted between Objects using the "Copy Format" and "Paste format" features in the Top Menu of the Capsule workspace.