Board Engine
Select
The Select execution on complex hierarchies with Entities containing millions of members has been greatly improved in terms of performance optimization and bug fixing.
Thanks to this improvement, waiting times when configuring a selection on very large hierarchies containing huge amounts of members have been greatly reduced. For example, in a scenario with a hierarchy with 4 branches, configuring a selection on an Entity containing more than 30 million members has dropped from a waiting time of 18 seconds to just 1
New Diagnostic log
The Exception log has been replaced by a new, improved log: the Diagnostic log. This new log can be configured to adjust its verbosity level so that debugging will be a lot easier, given the amount of information it can include.
These are the available verbosity levels:
Each log line will always include the following information: timestamp, error level, action, TaskId, user, CorrelationId, additional details specific for each action. Log files are rolled at the end of each month or when they reach a file size of 50 Mb, whichever comes first. Only the last 10 rolled files are kept. Log files older than two months are automatically deleted.
Off. The Diagnostic Log is turned off.
Error (default). Returns the same amount of information included in the previous Exception log.
Warning. Returns the same amount of information as the Error level plus exceptions with no impact on the user.
Information. Returns the same amount of information as the Warning level plus additional information about non-error actions, such as Data model loading, Dataflow executions, Data Reader executions, Data Entry actions.
At this level, the Diagnostic log file also includes lines written in all other Board log files. Entries generated by the same request have the same "TaskId" value, while entries belonging to the same Procedure have the same "CorrelationId" value.Debug. The highest verbosity level: includes the same amount of information as the Information level plus information about the start and end of each task.
Entities - The 40 millions members limit has been removed for Entities.
Resources optimization - The CPU usage on save to disk operations has been greatly reduced.
New Out of memory management settings - By default, when RAM saturation exceeds 85%, Layout executions that have been running for more than 5 minutes are aborted. Both the RAM saturation threshold and the Layout execution timeout can be configured via the RamSaturationPercentage and the LayoutExecutionMinutesTimeout parameters, respectively.
On-premises installations. The RamSaturationPercentage and the LayoutExecutionMinutesTimeout parameters have been added to the server_config_v2.xml file that can be found in the path C:\Program Files\Board\Board Server\ on the machine where the Board Server has been installed.
Cloud subscriptions. For Cloud customers, custom configurations can be applied by raising a ticket through the Board Support Portal. The ticket must contain your Platform name (e.g. customer1-s1.board.com). The Board Cloud Operations team will then handle your request.
The new Out of memory management system applies to all Layouts, except those configured in "Extract" Procedure steps and in the R Calculation step.
When Layouts get stopped by the new Out of memory management system, they are logged in the new RamSaturationActions log.
Data Reader - A Data Reader loading at least one Cube and one Entity code set on Add new item (Append) mode is now significantly faster and with less impact on external systems: the Data Reader now executes the query/reads the source file only once, whereas previously two cycles were required.
Layout - The Layout now handles many more combinations of Cubes and Entities in the axes, replicating data for missing dimensions consistently even when Cubes have a less granular structure or missing dimensions compared to the Entities set by Row and/or by Column.
More in detail, a lot of use cases involving the Total By, Refer To and Detail By functions have been examined and values are now replicated as expected.
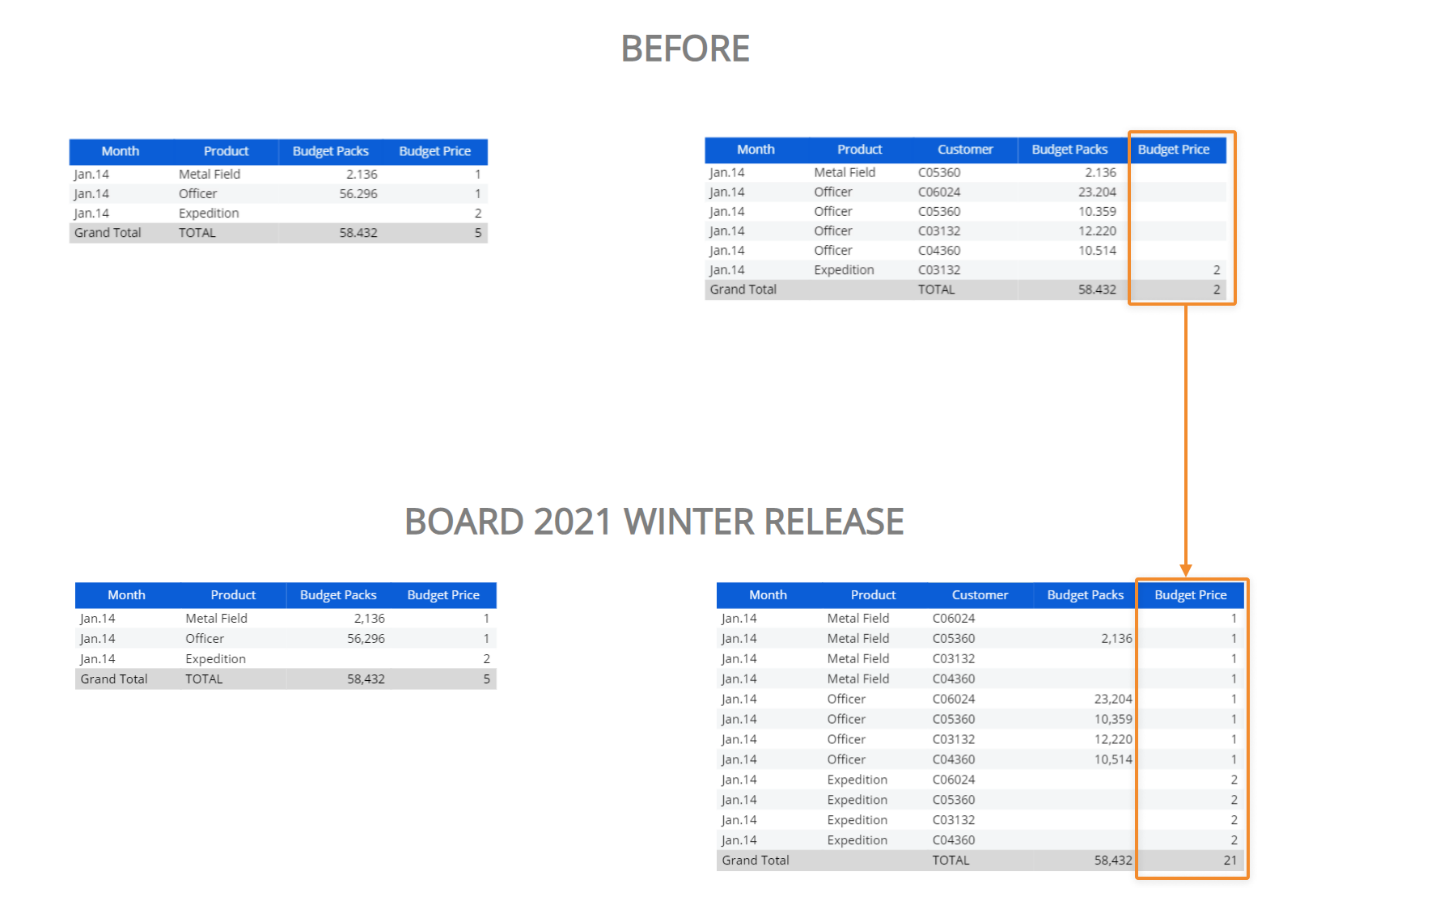
Here's a few examples.Layout with two Cubes and the Month, Product and Customer Entities set By Row. The Budget Price Cube doesn't have the Customer Entity in its structure, but data is still replicated as expected.
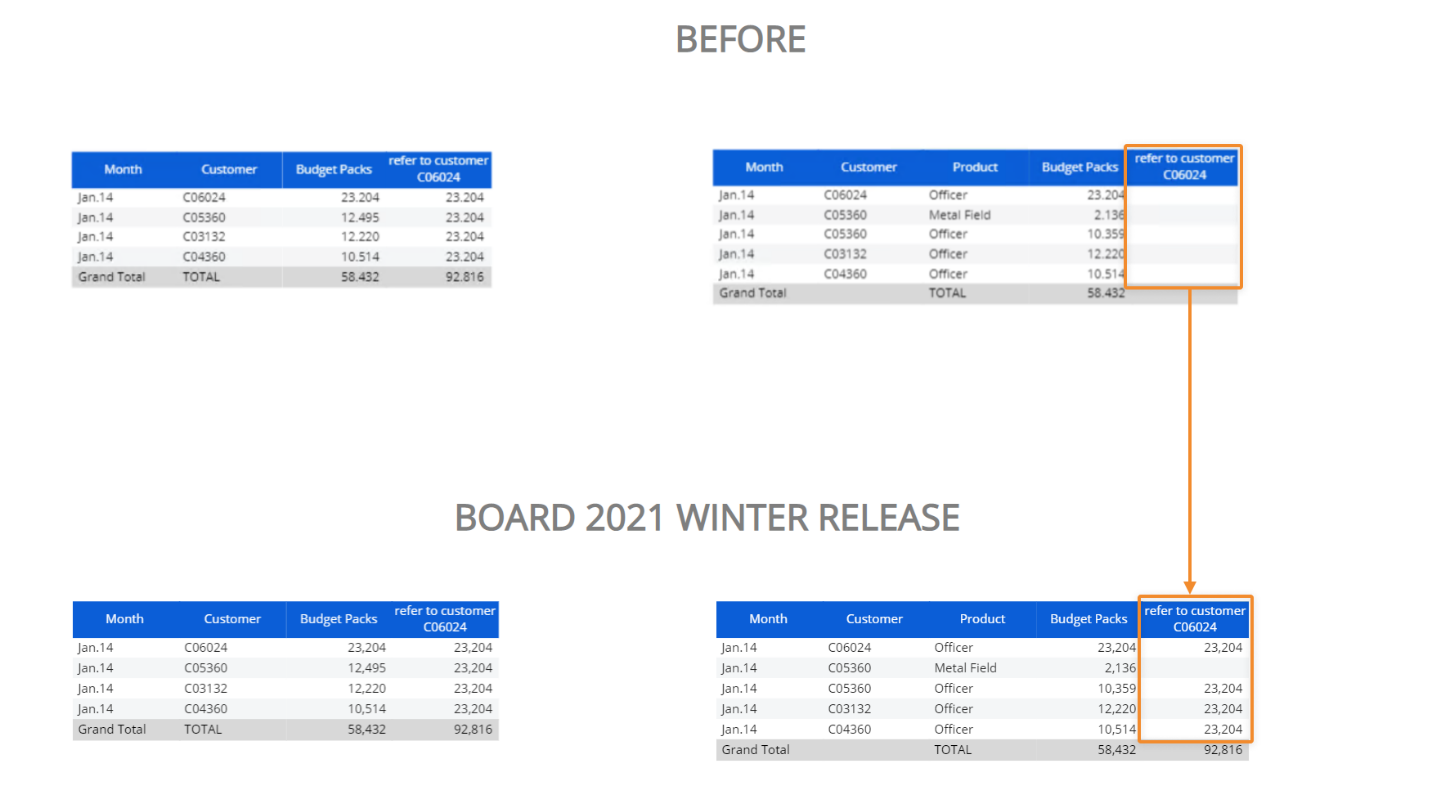
Layout with two Cubes and the Month, Product and Customer Entities set By Row. Both are Budget Price Cubes dimensioned by Month, Customer and Product. On the second Cube a Refer To condition has been applied on a specific customer and now Board is able to calculate the total value for the selected customer and replicate it for other Entities set By Row.
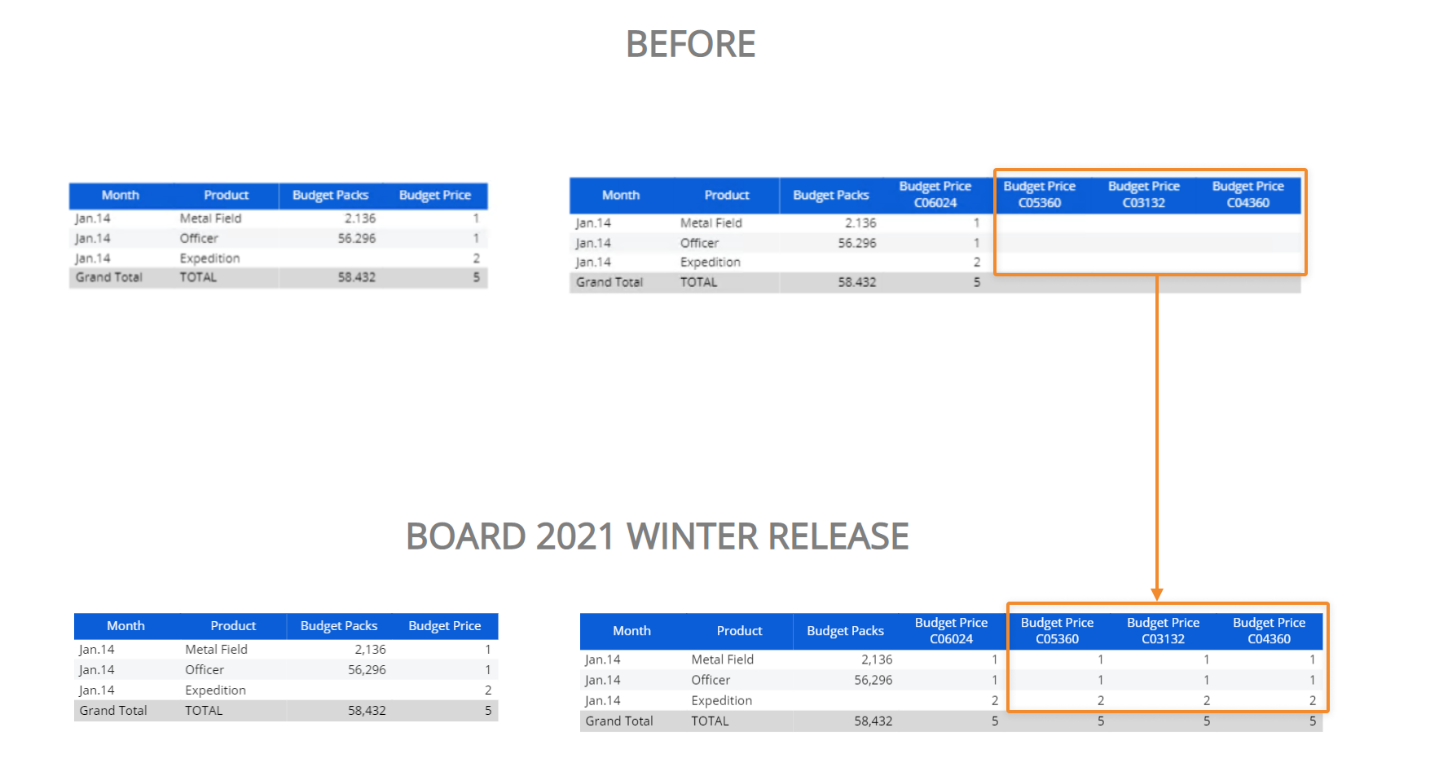
Layout with two Cubes and the Month, Product and Customer Entities set By Row. The Budget Price Cube doesn't have the Customer Entity in its structure, but a Detail By condition has been applied to it on the Customer Entity: now Board is able to calculate the total value of each product per month for all customers and replicate it accordingly on all active members of the Customer Entity.
Layout with two Cubes and the Month, Product and Customer Entities set By Row. Both Cubes are dimensioned by Month, Customer and Product, but some combinations of those three dimensions hold no values.
If you apply a Total By condition to the second Cube on the Product and Month Entities, now Board is able to calculate the total value of each product per month and replicate it accordingly on all active members of the Customer Entity set By Row.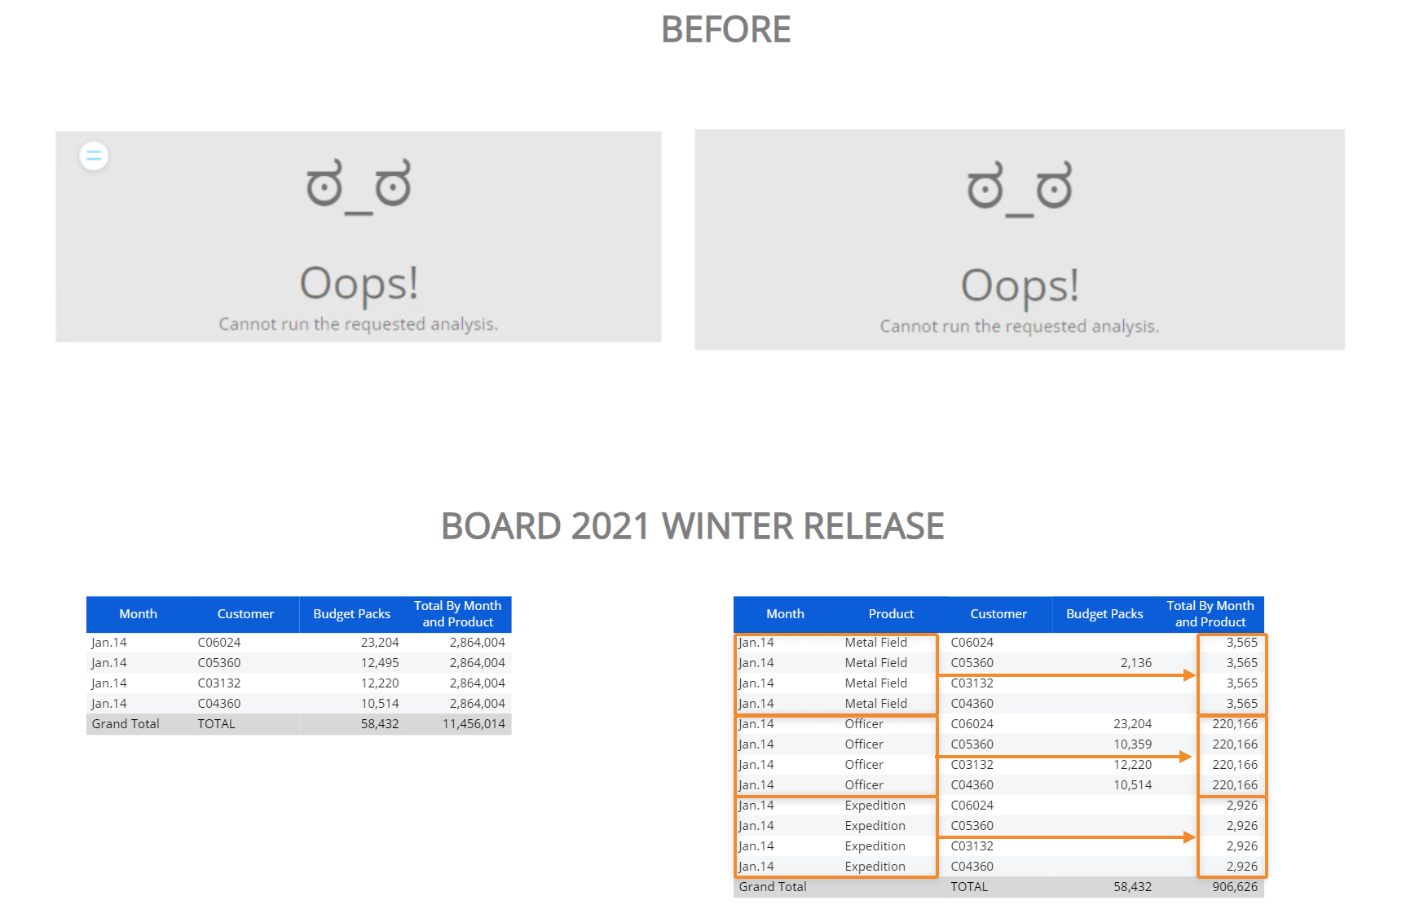
Other changes
Export document - A new feature allows you to merge all text Objects (Dynawrites) on a Screen into a Microsoft Word file and download it on the fly.
The Export document feature is available only for Dynawrite Objects: if you have added other Objects on the Screen, they will not be exported in the Word file.
To use the new feature, proceed as follows:
In Play mode, hover over a Dynawrite Object and click on the contextual menu icon (
 ) that appears in the top left corner to reveal the contextual menu as a sliding toolbar.
Select the Export document icon (
 ). A dedicated configuration popup window appears.
Give your file a name and click on "more" to hide or move individual Dynawrite Objects as desired. Enable the "Add a page break between sections" option to export each Dynawrite to a new page in the Microsoft Word file.
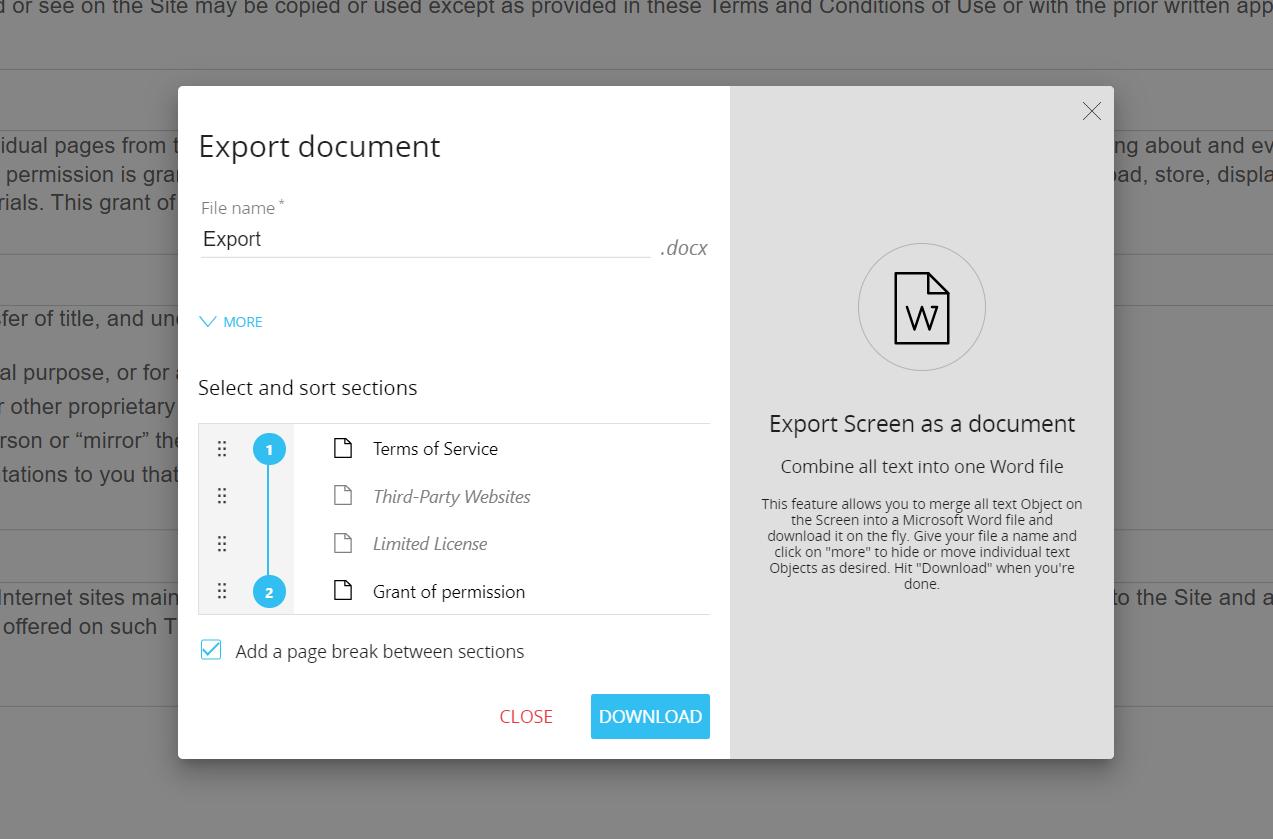
Click on the number at the side of each Object to prevent it from being exported. Disabled Objects will appear greyed out in the list. In Design mode, use the Tooltip field under the "Comments" menu to give each Dynawrite Object a name that will be used in the configuration popup window.
Click "Download" to save your configuration and download the file.
If you have a Developer or a Power User license, downloading the Word file will also save the export configuration and make it the default one for all users from then on. If you have a User, User 15 or a Lite license, downloading the Word file will also save your current export configuration. The configuration will be retained until you close the browser tab where you downloaded the file.
Show chart data- A new feature for charts allows you to view their data in the form of a Data View, displayed in a popup window similar to the one used for the drill-down.
To access the new feature, hover over a chart Object in Play or Design mode and click on the contextual menu icon ( ). From the sliding toolbar select the Show chart data icon (
  ) to open the dedicated popup window: the Data View displayed in it will show data from the same Layout query used to plot the chart.
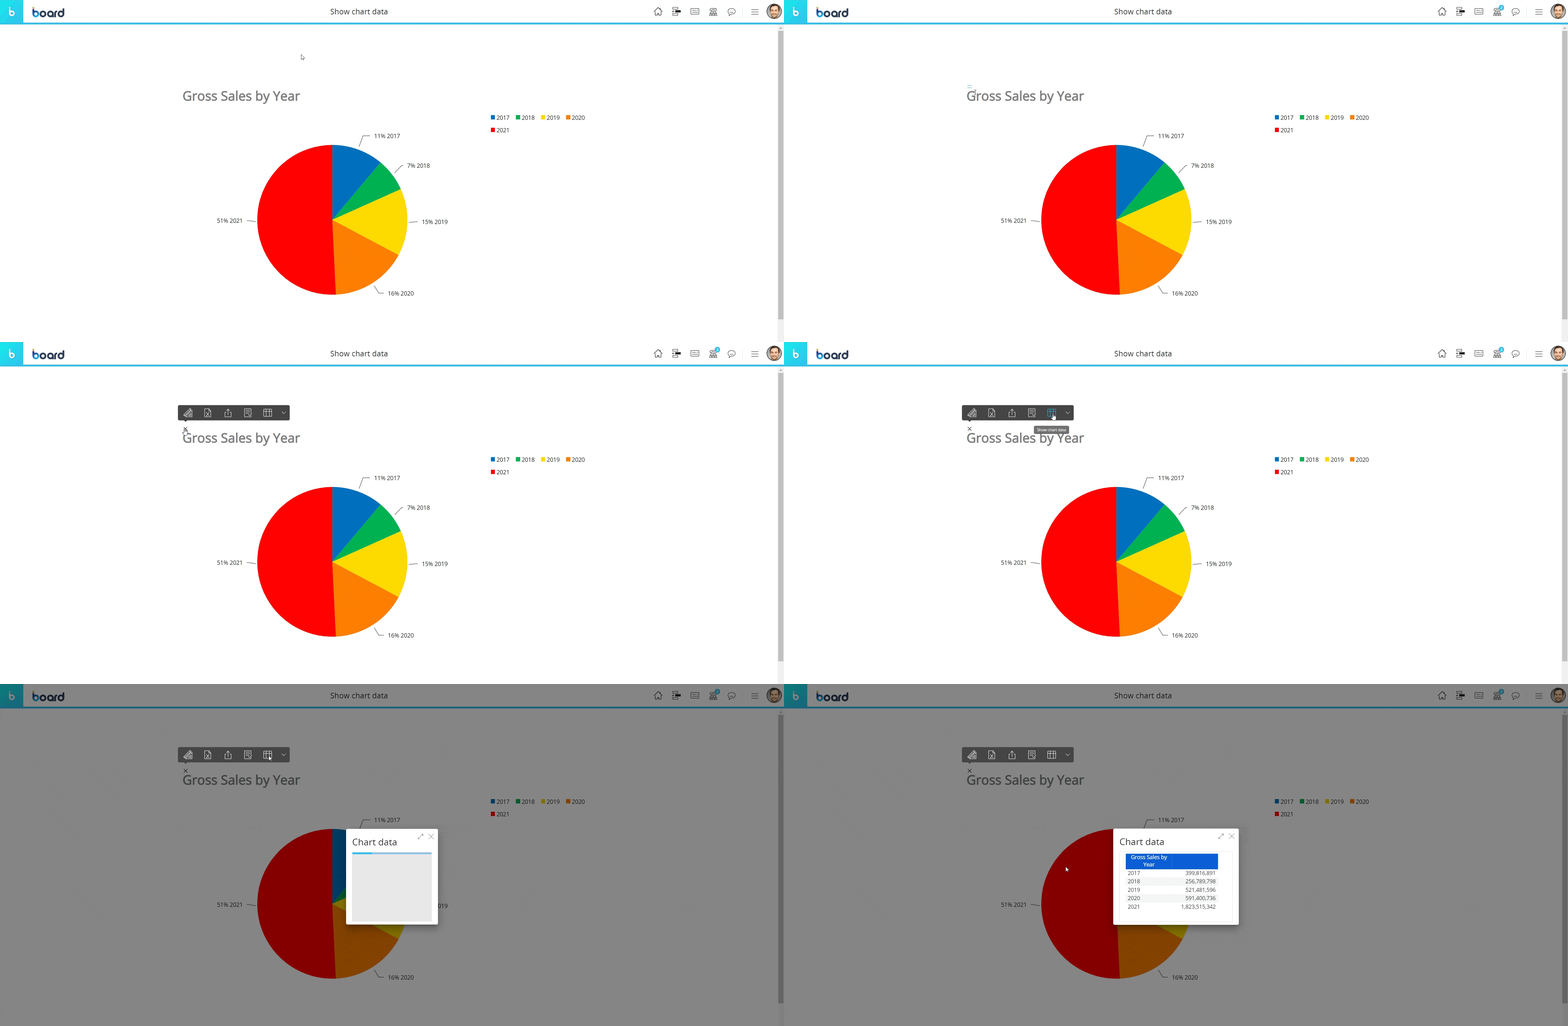
The Data View displayed in the popup window supports all classic Data View features, such as drills, data entry actions, export data functions, Nexel and so on.The layout editor cannot be accessed from the popup window.
Copy format between maps - You can now copy/paste formats between different Geo map Objects, so that transitioning from the previous OpenStreetMap Object to the new Google Maps Object is much easier.
User authentication - On Platforms not associated with a Subscription Hub now you can change the user's authentication type, for single users or in bulk.
The user's authentication type can be changed from the Users menu under the System Administration section. The available options are "Password" (Board authentication) and "Windows/LDAP/SAML/OpenId".
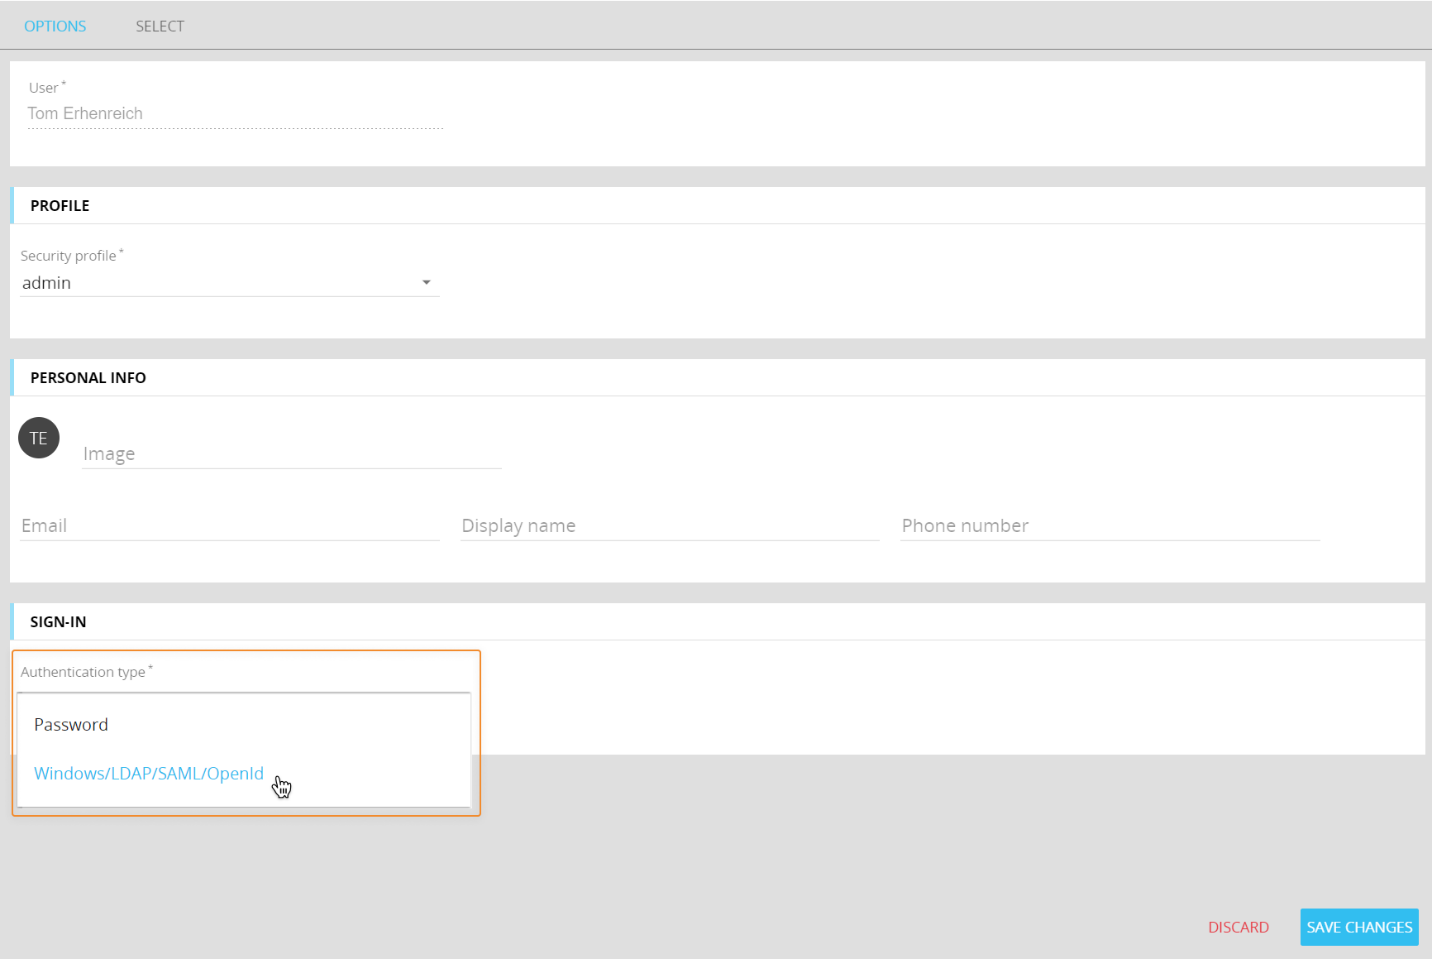
This new option is particularly useful, for example, before migrating to Cloud environments not associated with a Subscription Hub or to on-premises environments integrated with an external identity provider already available in your organization.Customizations on tables - Any customization made to tables in all Board sections (Data model, System Administration, etc.) are now saved and stored in the users's browser. These customizations are retained if you navigate to other pages or sections within Board, log off and on again, and even if you close the browser tab where you accessed Board.
Board saves the following customizations:Custom sorting.
Resized columns.
Groupings applied by dragging column headers onto the grey area above tables.
Custom column configurations made using the Column chooser button in the upper right corner of the table.
Custom filters applied using the interactive fields below column headers are retained until you close the browser tab used to navigate Board.
To reset all custom configuration made on tables, click the Reset button in the upper right corner of the table.
In the Data model section, if you land on the Entities page from the Analysis subsection of the Cube details page, previous customizations applied to the Entities table will be cleared. In the Data Reader section of a Data model, all selected rows in the table will remain selected until you deselect them: each time you return to the Data reader section, previously selected rows will still be selected.