This topic describes how to navigate and customize the settings and options of a Waterfall chart, both the chart made from a Cartesian Object and the Waterfall Object itself.
The Waterfall chart is described below in two parts because it can be configured in two different ways:
The Waterfall chart via the Cartesian Object shares most of its options and properties with the Cartesian chart, with a few exceptions described in the following paragraphs. While the Waterfall chart Object provides a lot more options and customization capabilities to display your data the way you want as described afterward.
Waterfall chart: Cartesian Object's Series type
Series menu
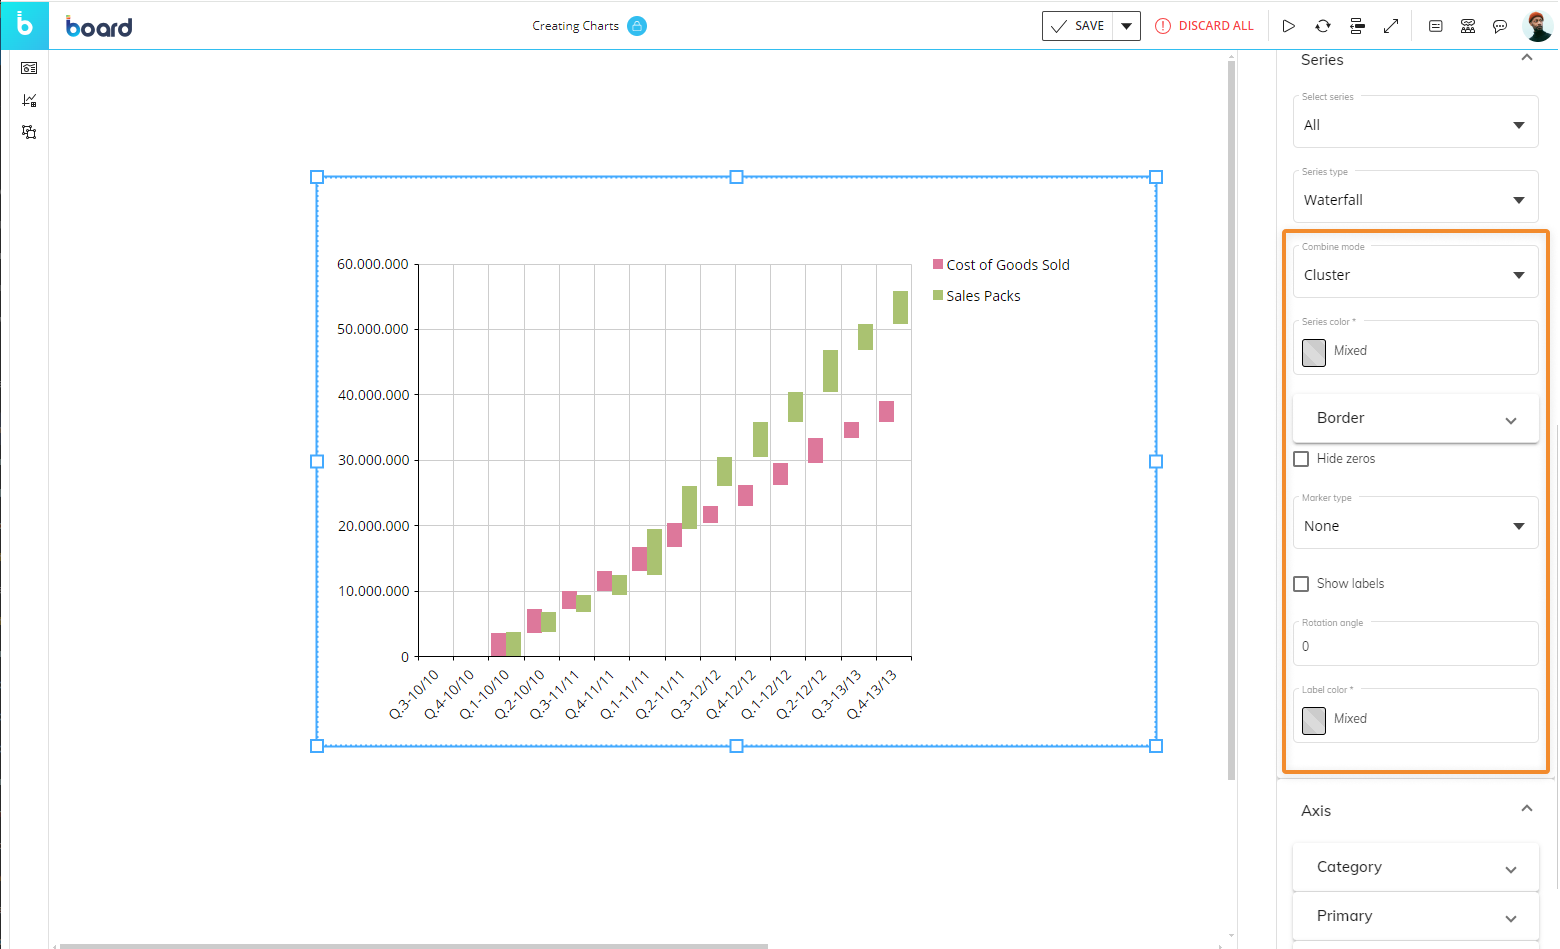
Under the Series menu, the following Waterfall-specific options are available:
Waterfall mode. Choose how data will be plotted in a Waterfall chart. The available options are:
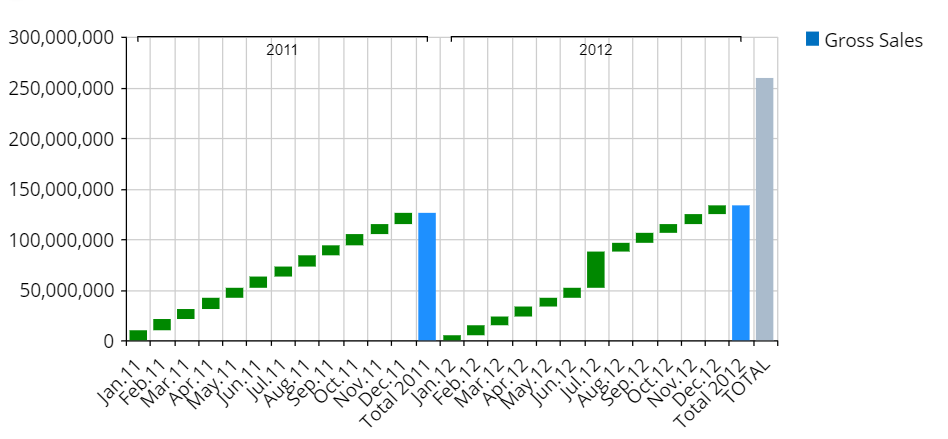
Cumulated. Bars displayed in the chart represent the series value for each category, plotted starting from the summation of all previous series values.
Example
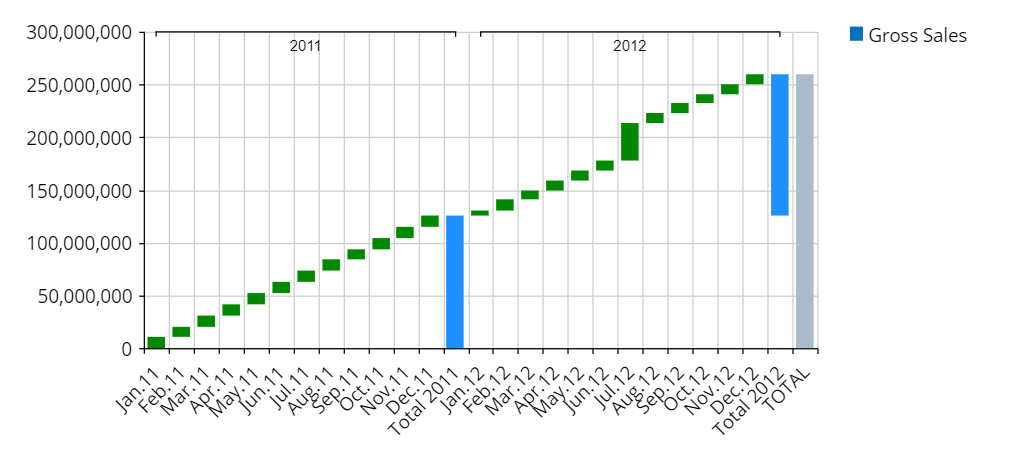
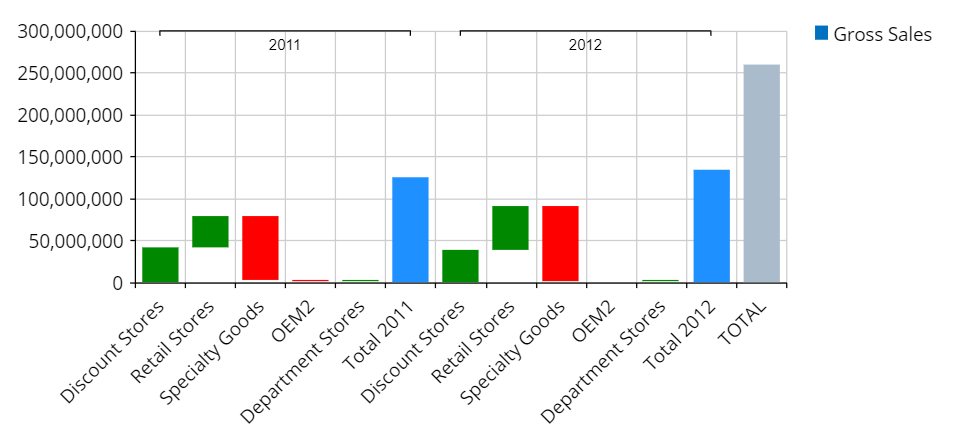
Cumulated by group. When Entity Grouping is active on a chart, enabling this option will cause the cumulation to restart from the zero baseline of the Y-axis at the beginning of each group.
Example. Notice how the cumulation starts from a baseline of zero after 2011.
Not cumulated. Bars displayed in the chart represent the difference between each series value and the previous one, plotted starting from the previous series value baseline.
Example
Border settings. Allows you to customize the border width and color of selected series.
Default colors. Allows you to set one color for positive Block series and another color for negative Block series.
Total colors. Allows you to set one color for positive total series and another color for negative total series. Total series are displayed when there are at least two Entities set in the Categories field of the Layout editor.
Grand total colors. Allows you to set one color for positive grand total series and another color for negative grand total series.
Waterfall chart Object
The Waterfall chart Object visualizes the cumulative effect of sequential or categorical positive and negative values applied to the starting value, but with much more options and customization capabilities than the Waterfall chart via the Cartesian Object to display your data the way you want.
Time-based additions and subtractions (for example, negative and/or positive values each month) or category-based (for example, various sources of revenues and various sources of expenses for a given time period).
Totals and major subtotals display as full bars that start from the baseline of the chart, while sub-components (contributors) of the incoming and outgoing streams are represented by color-coded floating bars.
Calculate variances between values of two Cubes for each member of the Entity set By Row, or visualize how each member of one Entity set By Row contributes, positively or negatively, to the grand total value of a single Cube.
Manually define each Block that will be visualized as a variance in the chart without the need to set an Entity By Row.
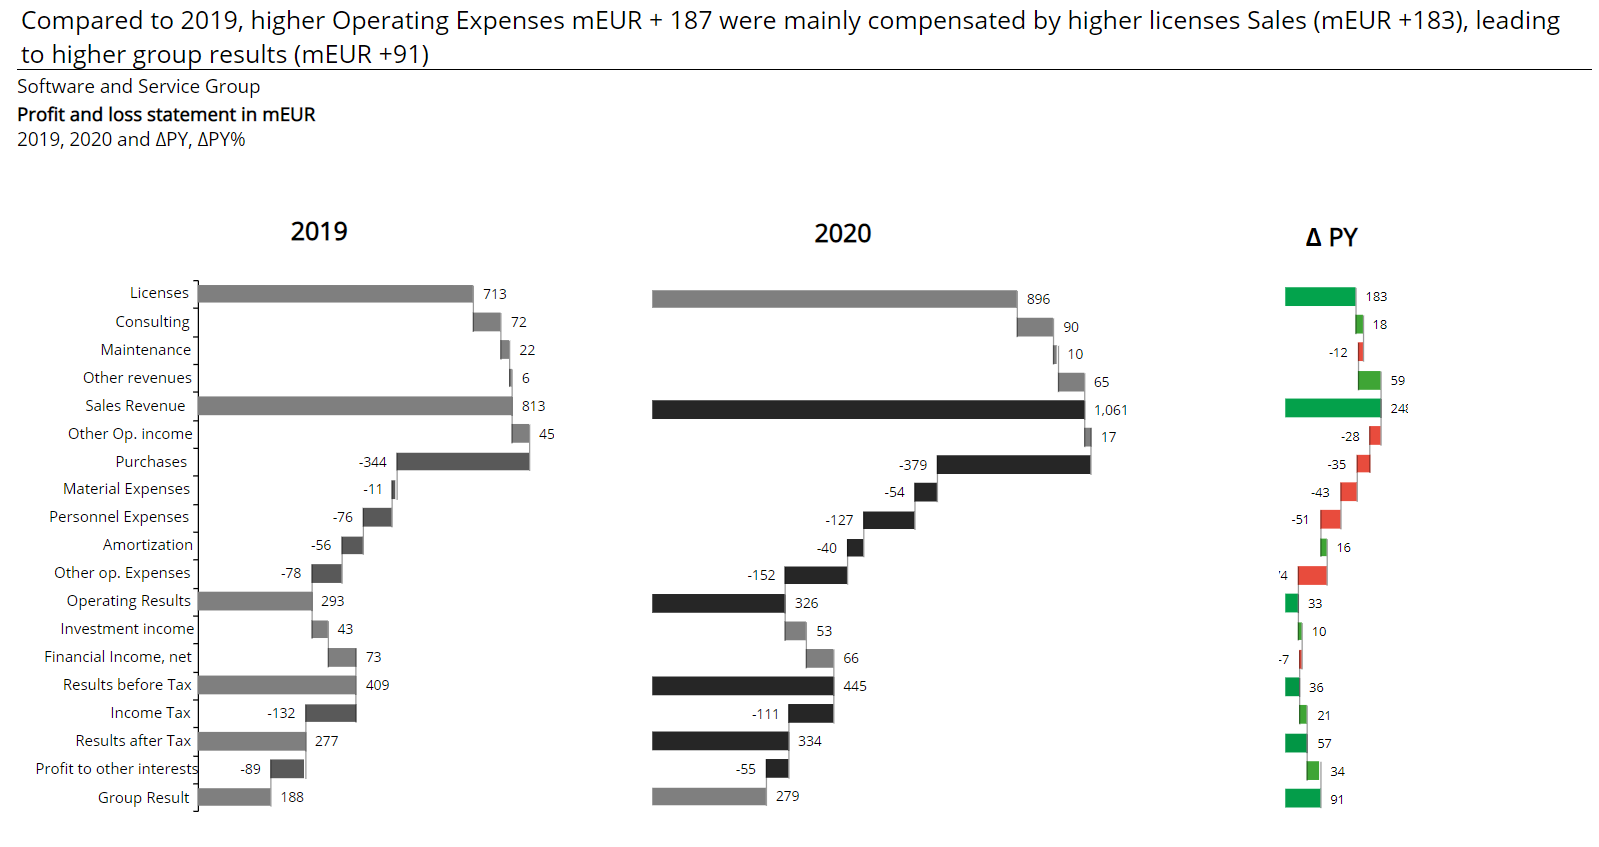
The following example shows three Waterfall charts in a Screen: two charts show the income statement of a company for two different years, while a third chart visualizes delta values for each account.
Waterfall Layout properties
The Layout editor for the Waterfall Object defines the data to be displayed in the chart.
Notable elements that differ from the general Layout editor are the Axes area and the Object settings of the selected "Starting Block" and "Ending Block", highlighted below:
The Waterfall Chart Object does not support the Detail By function.
Object settings
Under the Object settings panel, the "Starting block" and "Ending block" dropdown menus from the "Starting and ending block" menu page allow you to choose which Blocks in the Layout will be used as the starting and ending value in the Waterfall chart.
Axes area
In the Axes area, you can define which Entity will be used to plot the series (bars) in the chart.
The Waterfall chart Object doesn't support multiple Entities by row (Entity grouping). In the Axes area settings menu, the "Show all" option is always enabled and the "Down totals" option is always disabled since you can define subtotals from the Waterfall properties in the Screen design area. Any changes made to the Axes settings will be ignored.
In case a Layout includes only one Block, the last bar of the Waterfall chart will always display the sum of all previous values, regardless of the "Down totals" settings and custom subtotals (if any).
Waterfall Object properties and settings
The Waterfall Object has its own specific settings and configuration options. It also supports all options common to all Screen Objects, the Master Object option and the Disable Drill down option.
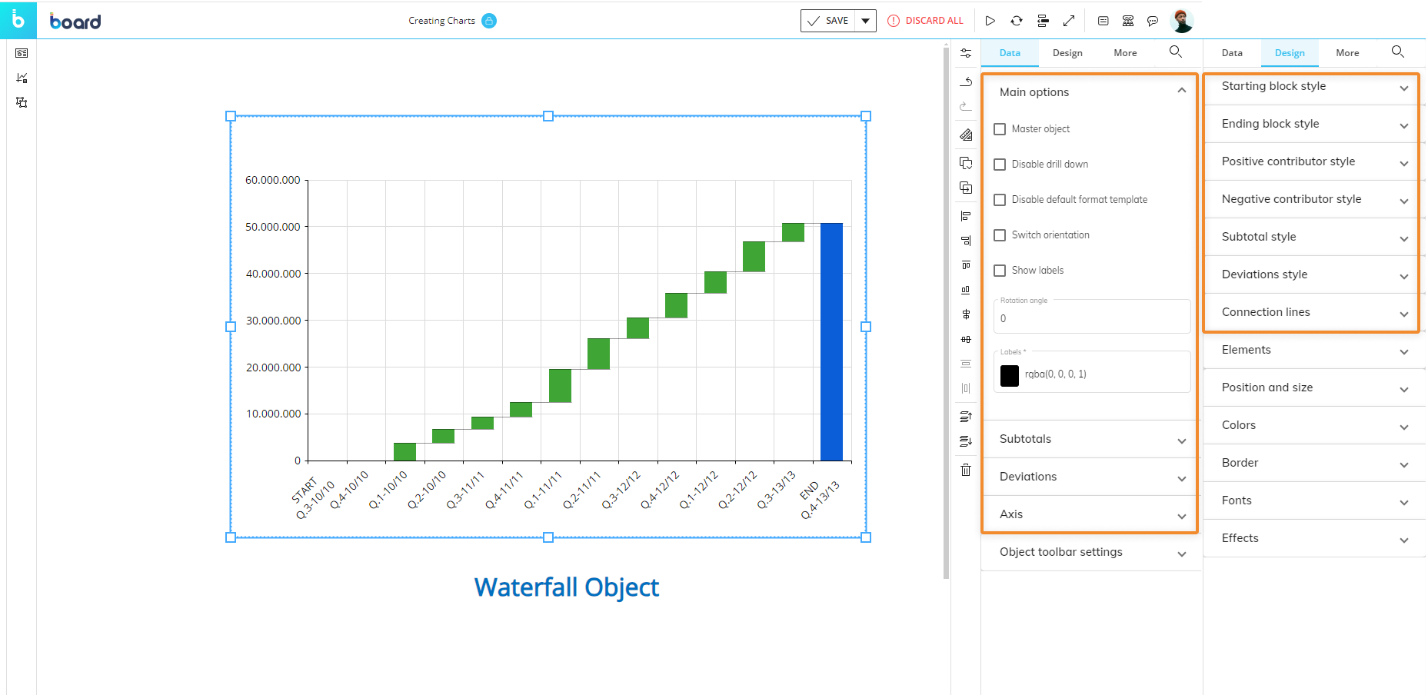
Properties specific to the Waterfall Object are highlighted in the following image:
Main options for Data properties
Under the Main options menu of the Data subpage, the following options are available:
Disable default format template. If enabled, it allows the Developer to override the default template applied to all series (bars) of the chart as described below in the Templates section of the Design properties. This feature is disabled by default.
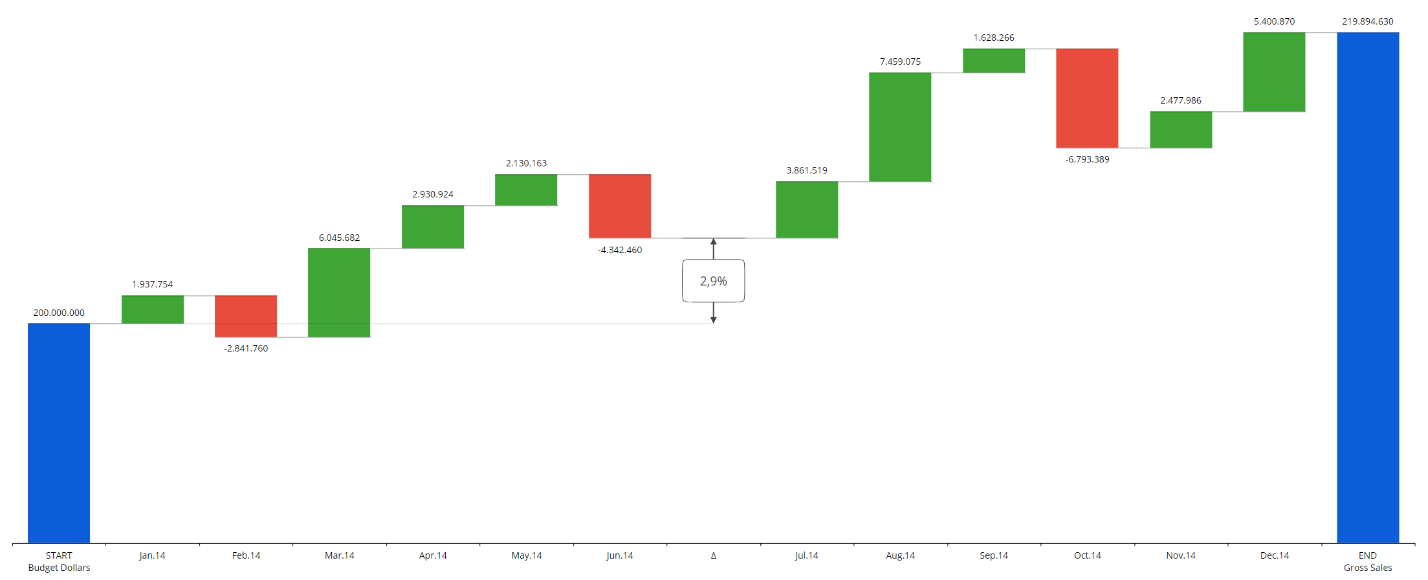
Switch orientation. If enabled, switches the chart orientation so that bars will be displayed horizontally. This option does not change the associated Layout.
Show labels. Enable this option to display data labels on top of each bar. Data labels display the value of each bar.
Rotation angle. Defines a rotation angle for data labels.
Labels. Applies the selected color to the background of data labels.
Subtotals
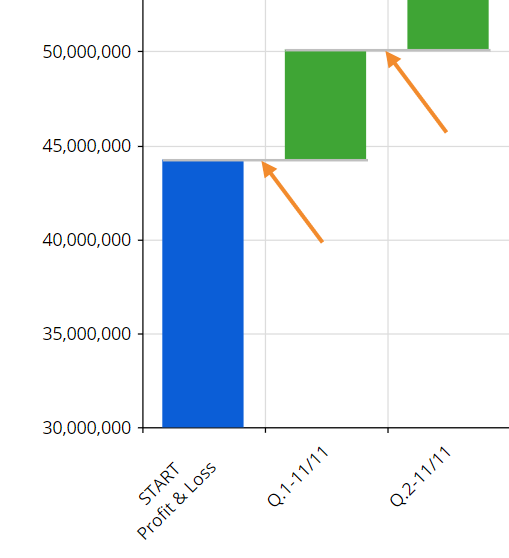
Under the Subtotals menu you can define which members of the Entity set by row will be displayed as subtotals. Subtotals are represented in the chart as full bars showing the total of all previous values, including the starting value.
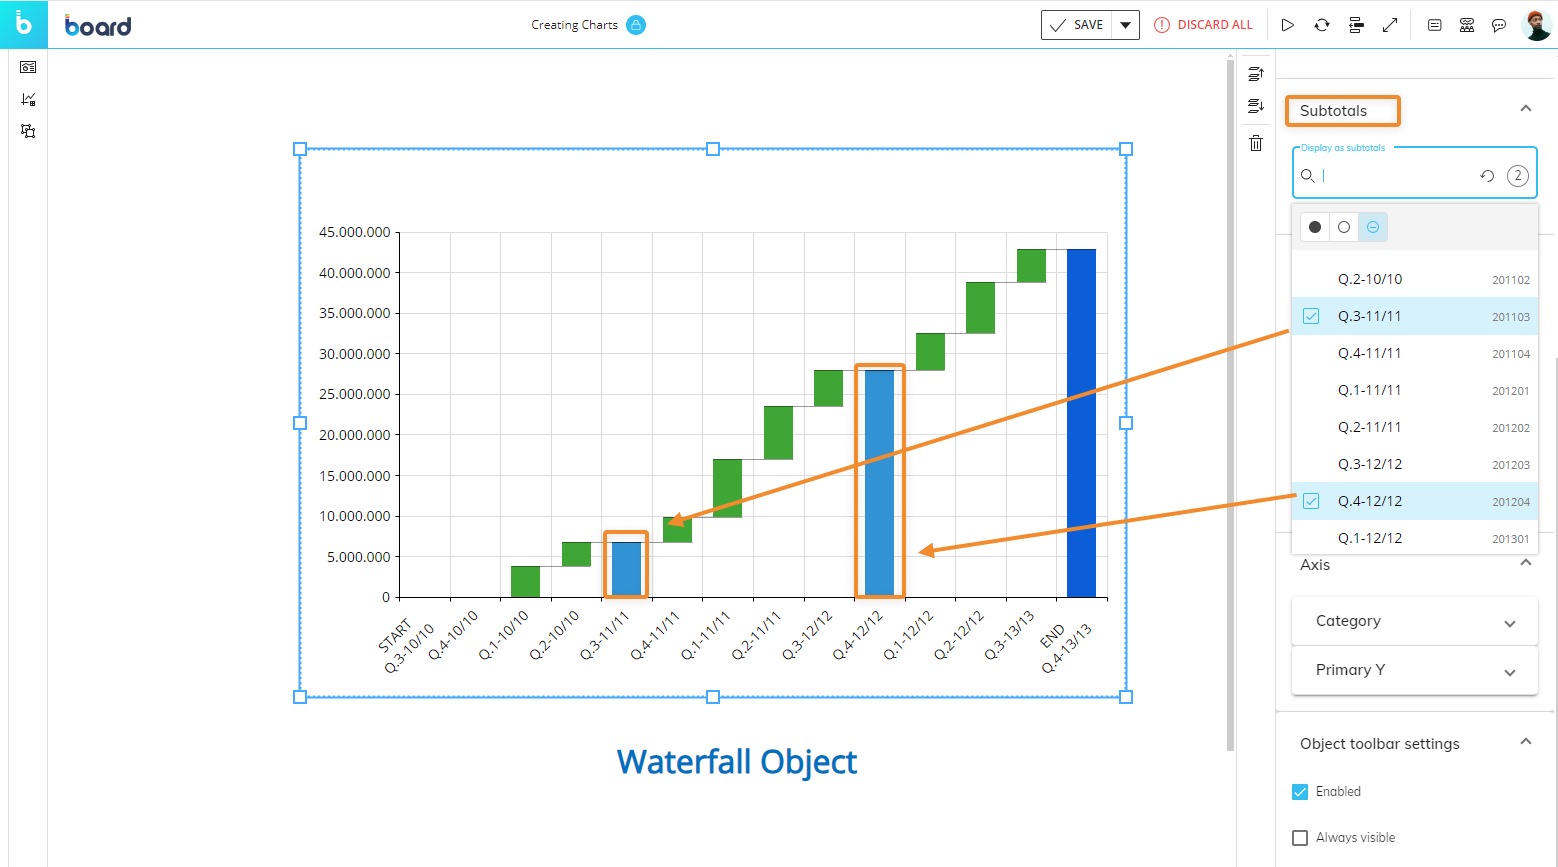
To define Entity members whose total value will be displayed as a subtotal, select the desired members from the dropdown menu.
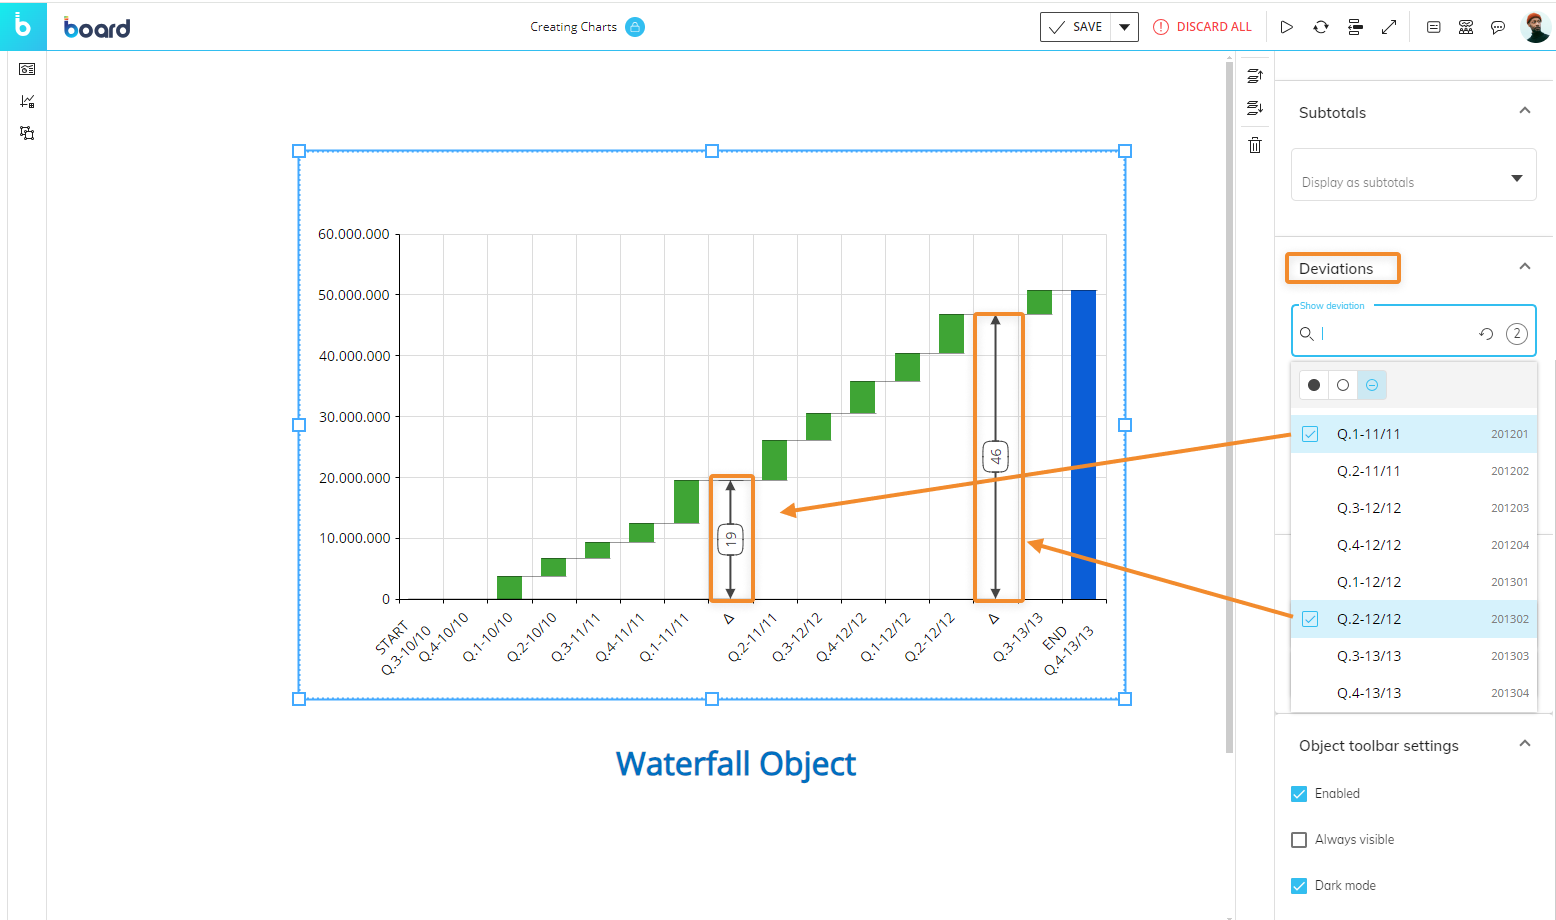
Deviations
The Deviations menu offers a set of features that allows you to define deviations from the starting value that will be visualized in the chart. To configure deviations, select the desired members from the dropdown menu. When the configuration is complete, the deviations will be plotted in the chart. Deviation values are displayed between the two arrows of the deviation line plotted in the chart.
If the deviation value doesn’t fit in the available space, the last numbers will be clipped and an ellipsis (“…”) will be displayed: hovering over the value will bring up a tooltip showing the number in full.
Other options available under the Deviations menu are the following:
Show deviation at the end. Displays the deviation between the starting value and the ending value at the end of the chart.
Show percent deviation. Displays the deviations as a percentage of the sum of both values.
Switch text orientation. If enabled, numbers in labels will be displayed horizontally.
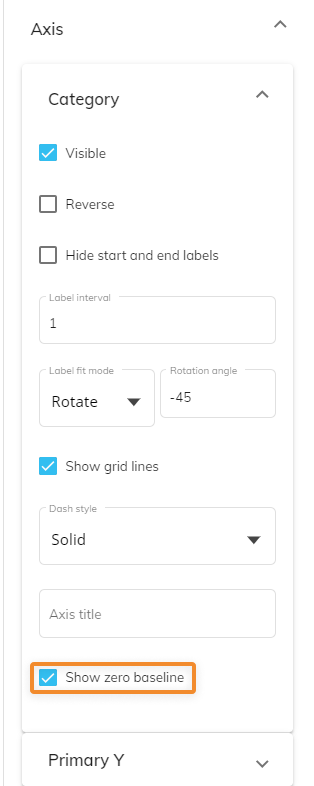
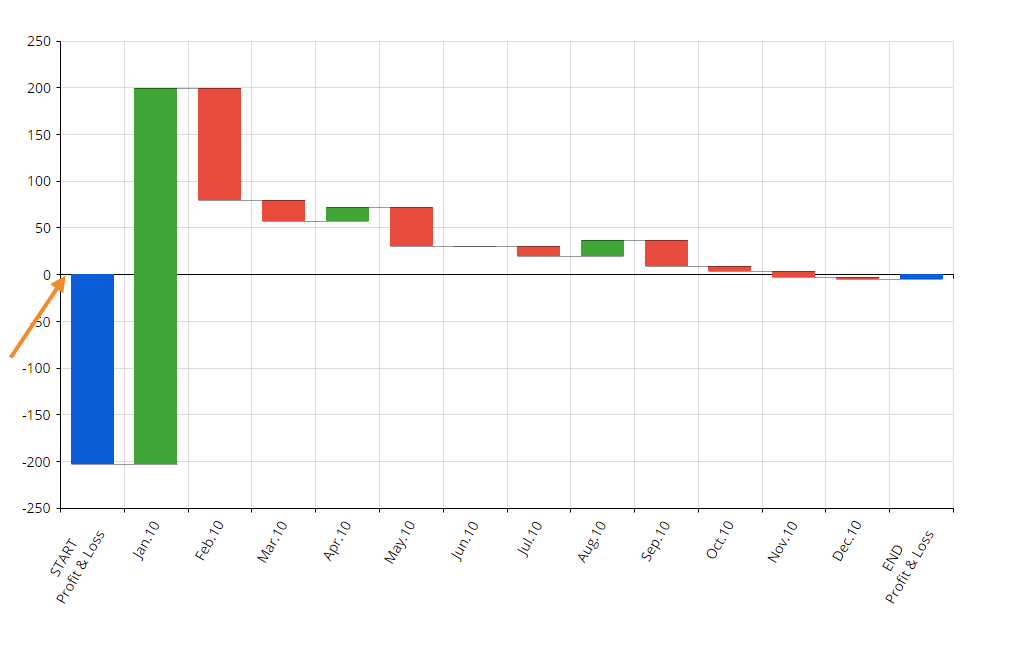
Axis menu
The Axis menu includes the same options available for the Cartesian chart, except for the "Show zero baseline" option in the Category axis submenu: if enabled, the zero baseline is plotted at the beginning of the starting bar as shown in the following image. This is especially useful for quickly identifying the zero baseline when the chart displays positive and negative values.
If the Auto zoom option is enabled on the primary or secondary Y-axis, the system automatically plots a scale break (a stripe) across the plotting area of bars to denote a break in continuity between the high and low values on the axis. This option is particularly useful if you want to display different ranges in various Objects included in a single Screen.
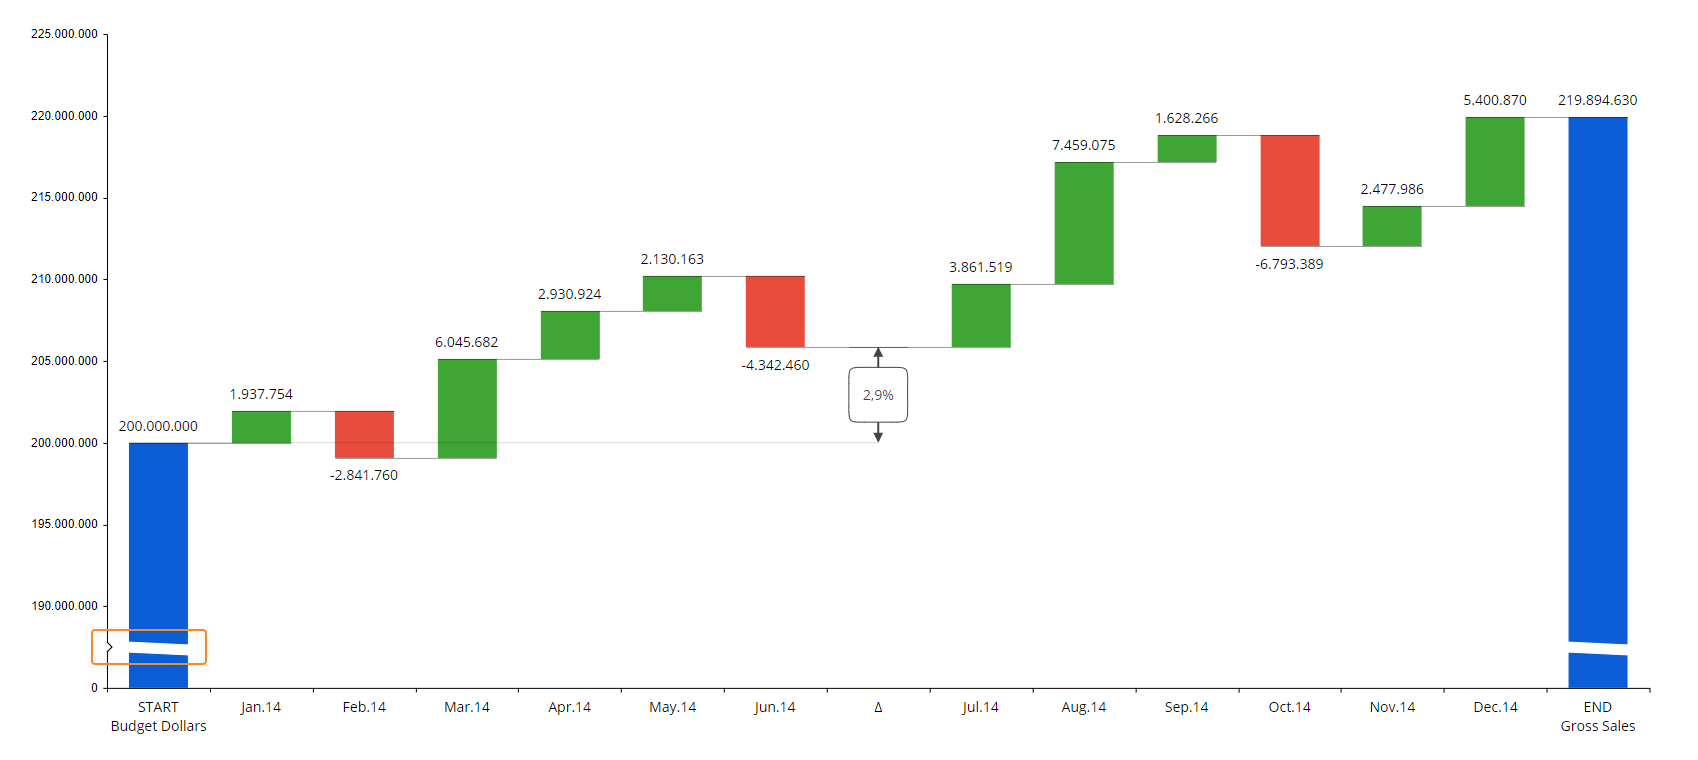
The automatic scale break appears only if the Auto zoom option is enabled and the initial value of the starting block is not zero. The scale break can be formatted in terms of color and border thickness using properties under the "Starting block style" and "Ending block style" menus in Design mode.
Object Design properties
Under the Design subpage and within the Starting Block style, Ending Block style, Positive contributors style, and Negative contributors style menus, you can customize a few format options for those elements of the chart:
Block color/Pattern color. Applies the selected color to the corresponding bars. If you apply a fill pattern, this optio.n defines the color that is applied to it.
Pattern. Select from various fill patterns to customize the corresponding bars.
Pattern background color. If a fill pattern has been configured, applies the selected color to the background of the corresponding bars.
Under the Border section, you can define the style, thickness and color of a border that will be applied to the corresponding bars.
The formatting options described above are also available for subtotals under the Subtotals style menu, where you can also define a specific style for each subtotal bar.
Templates
Under the "Templates" widget, you can assign a template in the appropriate menus within the the Waterfall chart properties panel in Design mode to apply formatting options to specific bars of the chart. You can define various formatting options for an Entity or for single members of an Entity that are set "By Row" in the Axes area of the Layout associated with the chart and save them in a Row style template.
You can find the "Templates" widget under "Starting Block style", "Ending Block style", and "Subtotals style" in the properties panel.
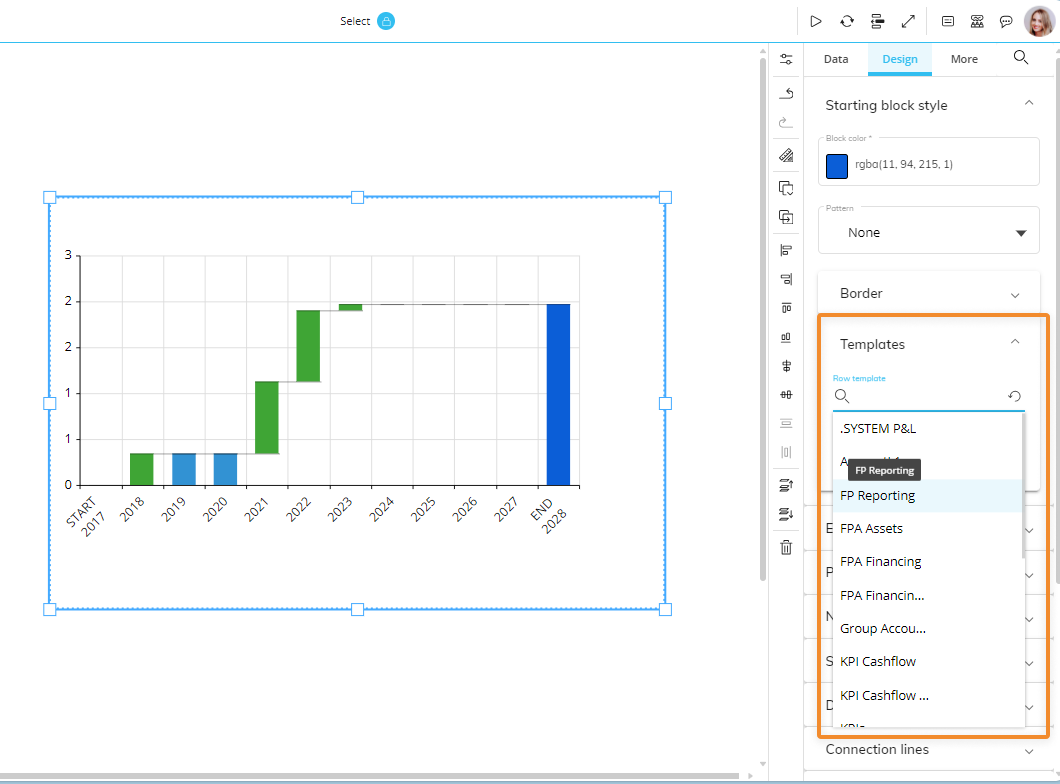
In the "Row template" dropdown menu, Developers will find all templates defined in the Data Model, regardless of the Entities used in the Layout.
As with the previous implementation, the formatting options in the template also work if the associated Entity is set in a "Refer To" option. In case of a "Refer To" option in place, only the template set as default for charts for the chosen Entity is applied and it cannot be changed at the Object level, as the template has the highest priority over any other formatting option. In case of a "Refer To" option in place and no default template configured for charts on the chosen Entity, no template is automatically applied: to apply one, the user must select it manually from the "Row Template" dropdown menu in a "Templates" widget.
MULTIPLE TEMPLATES There can be only one template applied to each supported chart element (Starting Block, Ending Block, and Subtotals): the template set manually in the "Template" widget has always the highest priority. If one or more "Refer To" options are set in the Layout and none of the configured Entities is linked to a default template, the template set in the "Template" widget is always applied, provided the Entity configured in the "Refer To" option is the same.
Given the potential impact of these new formatting options, it's important to understand the order in which Board applies formatting styles to charts, as this sequence determines how it will appear to the end user:
- First, the default chart style is applied, then the row style defined in the Template widgets is applied (if any)
- If a "Refer To" option is configured on an Entity which has a default template, this template will be applied with the highest priority above all other formatting properties
- If no default template is set, but it has been chosen manually from the "TEMPLATES" widget in Design mode, and the Entity associated with the template is not used in a "Refer To" option and it's not in the Layout axes (By Row), the active selection is considered. In this case, the selection on the Entity associated with the template must include only one Entity member.
SUBTOTALS If one or more Data Blocks have been selected as subtotals, the template is applied only if a “Refer To” option is configured on that Block.
If one or more Data Blocks have been selected as subtotals and a template for subtotals has been applied manually, its formatting options are applied only if one member of the Entity associated with that template is selected (through a Screen or Layout Select).
If one or more members of the Entity set By Row are selected as subtotals, the following scenario may occur: If a default template is set for the Entity, it will be applied automatically to the selected members, but if no default template is set for the Entity By Row and a template associated with a different Entity has been applied manually, its formatting options are applied only if one member of the Entity associated with that template is selected (through a Screen or Layout Select).
Templates are always applied during the Layout execution. Existing formatting properties applied at the Object level are always kept, even if a template is applied: if you unlink a template from the Object, the Object will automatically revert to the previously saved formatting properties. This also applies to default templates. If a template applies custom formatting properties only to specific members of an Entity, other members of that Entity will inherit the existing formatting properties applied at the Object level.
Deviations style
Under the Deviations style menu, you can define a style for labels (outlined or filled) and a color that will be applied to their outline or background.
Connection lines
In the Connection lines menu, you can show/hide a line that connects the starting value of a bar with the ending value of the previous bar. You can also configure the thickness and color of those lines.
Waterfall Chart: Application scenarios
Depending on how the Layout is configured, the following scenarios may occur.
Calculated Waterfall chart: Layout with two Blocks and one Entity by row
If you add one Entity in the Axis area and two Blocks in the Data area, Board will automatically calculate variances once you configure the Starting and Ending Block in the Object properties panel. You can also configure subtotals and deviations as you see fit.
This configuration is especially useful, for example, when you need to calculate variances over months or other periods from the same Cube (added twice in the Layout) or from two different Cubes.
Variance breakdown Waterfall chart: Layout with one Block and one Entity by row
If you add a single Block in the Data area and one Entity in the Axis area, no calculation will be performed as Board will only visualize values for each member of such Entity. If your Layout has only one Block, you won't even have to configure the Starting and Ending Block in the Object properties panel, as this will be done automatically.
In this scenario, the first Entity member will be displayed as the starting bar, while the last member will be displayed as the ending bar. You can also configure subtotals and deviations as you see fit.
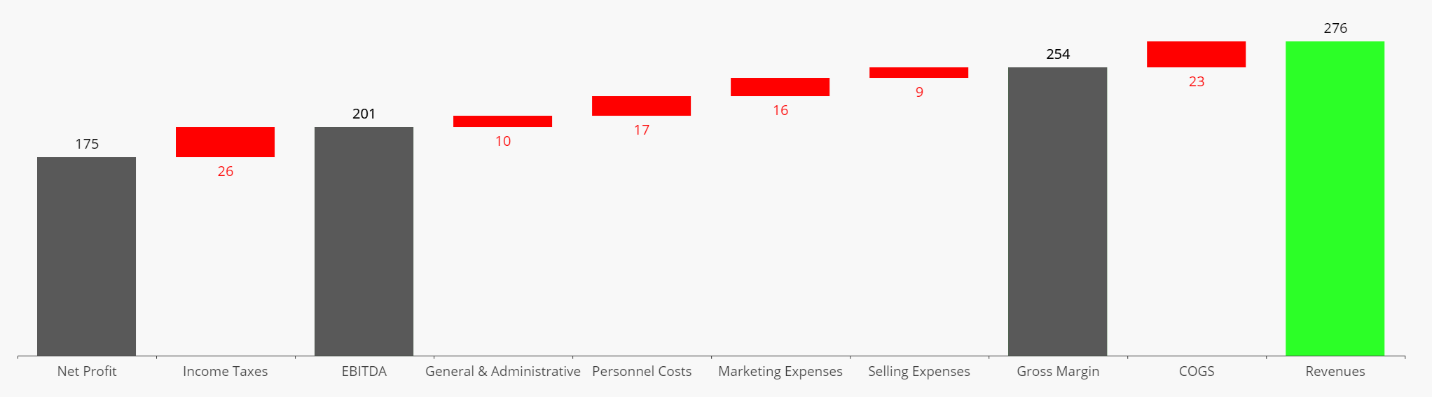
This configuration is especially useful, for example, to visualize Income Statements where each account contributes to the final result.
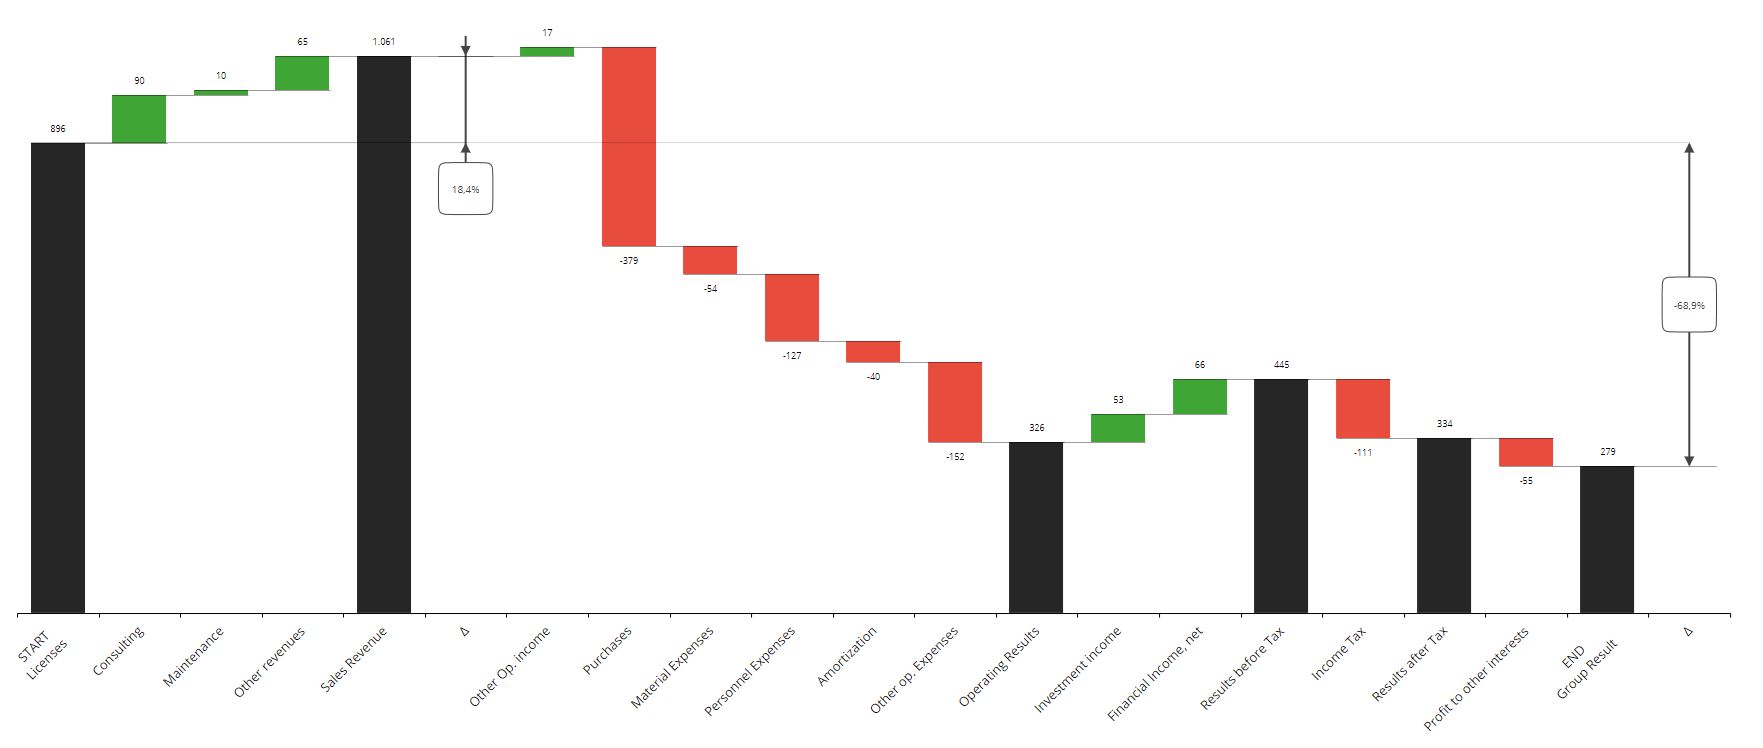
Custom Waterfall chart: Layout with at least three Blocks and no Entity by row
This scenario provides maximum flexibility when designing your Waterfall chart. Add as many Blocks as you like and define the Starting and Ending Block in the Object properties panel: all remaining Blocks will be displayed as variances in the chart.
You can change the order of variances by dragging and dropping the corresponding Blocks to a different position in the Layout editor. You can also configure subtotals and deviations as you see fit.
Since each variance is a manually defined Block, you need to make sure that all values are correct: the Waterfall chart will plot data as it is loaded.
This configuration allows you to quickly design your own Waterfall chart in complex scenarios where data is not organized properly for variance analysis or is missing.