Create forecast models for your leading business drivers. Your real-time predictive models enable you to view how the forecast predicts the performance of your company over the coming months and quantifies relationships using a regression approach. This article covers:
How to Create a Model from a Predict Job
Navigate to the Predict page.
Select the Predict job you wish to use as a basis for a Model.
.png)
You are brought to the Predict Results tab. Select your preferred Model Result.
.png)
Click the kebab menu and select Create Model.
.png)
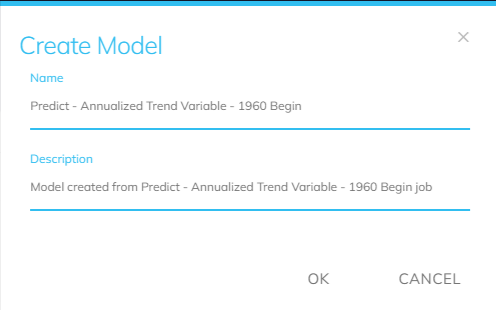
The Create Model modal pops up. A name and description of your model is automatically generated. Review the name and description, and edit if wanted. Select OK when finished.
A new window opens and you are automatically brought to the Model Output page. You have successfully created a Model from a Predict job.
.png)
Model Output Page
After opening a model from the Model screen in Projects, you are brought to the Model Output Page. This screen allows you to see different ‘views’ of the Model. Use the left-hand side navigation to toggle features to change the view of the page.
.png)
Model Overview
View the statistics that contribute to the overall Model Quality Score..png)
Accuracy of Insights: A measure of how accurately the independent variables explain the dependent variable. It ranges from 0-100%, where 100% means the model has no bias, in which predictions do not systemically over- or under-estimate.
Accuracy of Predictions: A measure of how accurately the model produces the forecast. It ranges from 0 to 100%, where 100% means that we can rely on the predictions of the model with confidence.
Model Efficiency: A measure of how stable the coefficients are as we add new data to the model. It ranges from 0-100%, where 100% means the model’s coefficients are very stable.
Model Performance: A measure of the overall performance. It is comprised of MAPE, Residual Trend, and Predictive R-squared.
Model Score: A comprehensive score for your model that includes Model Bias, Model Efficiency, Forecast Accuracy, Overall Model Performance, and Penalties. It normally ranges from 0 to 1 (100%), where 1 is the best score, however the score can be negative if there is a penalty.
Penalty: The utilization of assessing model performance based on specific criteria (i.e. correct coefficient relationships). This effectively accounts for discrepancies between model outputs and actual results, providing a mechanism to adjust the scoring of the model based on its performance.
Model Health
Displays the health status of the model, involving diagnostics on how well the model is performing and its reliability. Model Health is toggled off by default and can only be generated for locked models.
.png)
Model Health Score: An overall score for the model's performance based on various statistical measures and fitting criteria used in the modeling process.
Model Health Details: This section outlines specific metrics and characteristics that contribute to the Model Health Score.
Control Chart Based on Residuals: This chart visualizes the residuals of the model, allowing users to assess if there are patterns over time, which could indicate issues with the model fit. Residuals should ideally be randomly distributed around zero.
.png)
Control Chart Details: In-depth information on the control chart, including thresholds and warnings about the residuals, helping users to identify potential problems in the model.
.png)
Root Cause Calculation: An analysis of the residuals to determine underlying causes for any deviations or unexpected values in the forecast compared to actual data, helping to identify which factors might be influencing model performance adversely. This chart can be saved in a CSV file format.
Base Period: The frame or set of periods used as the reference for comparisons when assessing performance or calculating variances in the model's outputs.
Time Period: The duration for which the analysis is being conducted, encompassing the periods that are being evaluated during the root cause analysis.
Display Units Percent: This setting controls whether the displayed results are shown as percentages, which allows for easier interpretation of how individual elements contribute to the overall performance and variance.
Display Average Error Legend: This indicates whether the average error is shown in the legend of the chart, providing context regarding the error rates across the analyzed periods, making it easier for users to understand the model's forecasting accuracy over time.
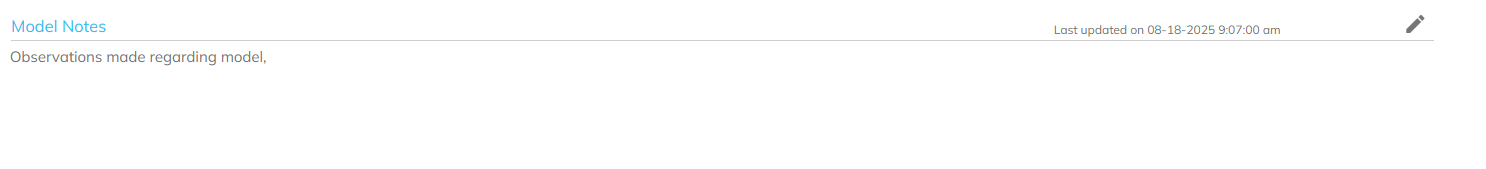
Model Notes
Space for user-defined notes regarding the model’s development, changes, or insights.
Information
Contains key parameters and configuration settings of the model, including target datasets and other model specifications.
.png)
Forecast and Target Datasets: The Forecast Dataset is the primary indicator that is being forecasted and the Target Dataset is the alternative forecast.
Frequency and Calculation: The Frequency is the highest level of granularity based on the primary indicator’s data. Calculation displays which type of calculation has been applied to derive the forecast model i.e. None, Period over Period, Year over Year, etc.
Status: The current state of the model i.e. Locked, In-Progress, etc.
Overview: A summary of the model including key metrics and performance indicators that give insights into what the model aims to achieve and its readiness.
Explanatory Variables: The independent variables that are factored into the model.
Raw Forecast
Shows the raw forecast results generated by the model.
.png)
Directional Symmetry 12 Periods: Raw forecast statistic that depicts directional symmetry over the last X points.
Monthly Values: The displayed indicators on the chart on a monthly basis, allowing for detailed short-term analysis.
Quarterly Values: Users are able to aggregate monthly data to quarterly summaries, providing insight into long-term trends.
Semi-Annual Values: Users can analyze semi-annual periods using combined quarterly summaries.
Annual Values: Users can aggregate data on an annual basis for a comprehensive yearly overview.
Period/Period Forecast
Displays forecasts based on changes from one period to the next, reflecting short-term trends..png)
Year/Year Forecast
Compares the forecast for a specific time period against the actual data from the same period in the previous year..png)
Three Period Year/Year Forecast
Analyzes a moving average for the past three years against the same periods in the current year. Three Period Year/Year Forecast is toggled off by default and cannot be generated because it is not supported by variables that use log transformations.
Accuracy
Shows the error measurements and performance of the forecasts, highlighting the reliability of the predictions. Accuracy is toggled off by default and cannot be generated because it requires adjusting the "as of" date for visibility. If the model's regression start date occurs after the customer data start date, accuracy calculations will not consider data prior to the regression start date.
Component Contribution
Indicates how much each individual indicator contributed to the prediction outcome of the model.
.png)
Relative Importance
A rank of indicators based on their significance to the overall model. Shown for segment in the model if there are multiple.
.png)
Waterfall
A display of the contribution of each indicator to the total forecast, often used to illustrate how each component adds up to the final figure.
.png)
Risk
Displays risk estimates associated with the forecast, comparing predicted outputs against potential targets. Risk is toggled off by default and cannot be generated because it is not supported by variables that use log transformations.
Risk Growth
Similar to the Risk toggle, but focuses on changes in risk year over year. Risk growth is toggled off by default and cannot be generated because it is not supported by variables that use log transformations.
Consistency
Analyzes how consistent the model’s forecasts are over time.
.png)
Standard Coefficient Efficiency: This metric evaluates how well the model predicts outcomes based on the relationship between the independent variables and the dependent variable, typically represented as R^2. A higher score suggests that the model explains a larger portion of the variability in the data.
Average Single Period Error: This error value is determined by comparing the forecast for a single period (e.g., month) to actual results from the same period. It provides insights into the accuracy of the model within individual periods.
Model + Standard Coefficient Toggle: Switch between viewing the model outputs in terms of standard coefficients or raw coefficients, providing different perspectives on the model results.
Average Aggregate Error: This aggregates the errors over multiple periods and provides an overall measure of error for a set range of periods (e.g., three months). This helps in understanding the consistency of predictions over time.
Average Single Period Error Box Chart: This graph presents the distribution of errors for single periods, allowing users to assess variability and detect outliers in forecasting accuracy.
Average Aggregate Error Box Chart: Similar to the Single Period Error Chart, this box chart displays the distributions of aggregate errors across periods, aiding in the evaluation of overall trend consistency in the forecasts.
Waterfall - Raw: This chart provides a representation of changes in the raw forecast values over time, highlighting contributions from various factors or changes in predictive variables. It helps users visualize how different segments or adjustments affect the overall forecast.
Statistics
Provides various statistical measures of the model’s performance, helping to assess the validity of the forecasts.
.png)
Diagnostics
Offers diagnostic checks on the model, including potential issues that could affect its performance.
Residuals: The differences between the actual data points and the values predicted by the model. They are a critical component for assessing the accuracy of the model, as they indicate how well the model fits the data.
List of Influential Outliers - In Raw: This metric assesses how much identified influential outliers affect the overall model fit. It provides an indication of the degree to which these outliers may disproportionately influence the residuals and, consequently, the model accuracy.
.png)
Statistics: This refers to various statistical measures computed for the model, such as Means, Variances, and other relevant metrics that help evaluate the model's predictive capabilities and performance.
Correlation Matrix: This matrix shows the relationships between explanatory variables, helping users understand potential multicollinearity issues and how independent variables are correlated with each other and with the dependent variable.
Model Lineage
Information regarding the history and evolution of the model, including previous versions and their performance metrics.
.png)
ALL VIEWS
.png) Burger Menu
Burger Menu
Lock Model: Lock your model to remove it from in progress. Deselect to open your model to in progress.
Edit: Apply tools to and view your model data.
Model Settings: View and alter your Forecast Model Consistency start and end date.
Edit Model Data: View and alter the Model state, name, and description of your Model.
Tag: Add a tag to your Model for easy navigation.
Copy: Copy your Model.
Add Model Indicators to Alerts: Set up alerts based on specific indicators within your Model. This functionality ensures that users are notified when certain conditions related to their chosen indicators are met, enabling them to stay informed about changes that may require attention.
Add Model Forecast to Alerts: Set up alerts that are triggered based on the forecasts generated by your Models.
Change Algorithm: Choose between Multiple Regression or Segmented Multiple Regression.
Create Indicator: Create an indicator using your Model.
Create Workbench: Create a Workbench using your Model as a basis.
Create Report: Create a Report using your Model as a basis.
Change Owner: Change the owner of your Model.
As Of: Choose an As Of date for your Model.
Associated Items: View the items associated with your Model.
Historic Periods: Select the historic period for your Model
Export to CSV: Download your Model to your device.
PowerPoint & Excel Export: Export your Model to PowerPoint and/or Excel.
Print: Print your Model.