Predict is an automated model-building engine that generates multivariate regression models from indicators in a Workbench. It tests different combinations of indicators and produces ranked models based on quality scores.
Predict works best with 30–40 diverse indicators.
Validation messages in the Workbench guide you to avoid using highly correlated indicators.
Predict outputs up to 250 models, allowing you to explore, compare, and select the most suitable one.
This article describes:
How to Create a Predict job
Navigate to the Workbenches page.
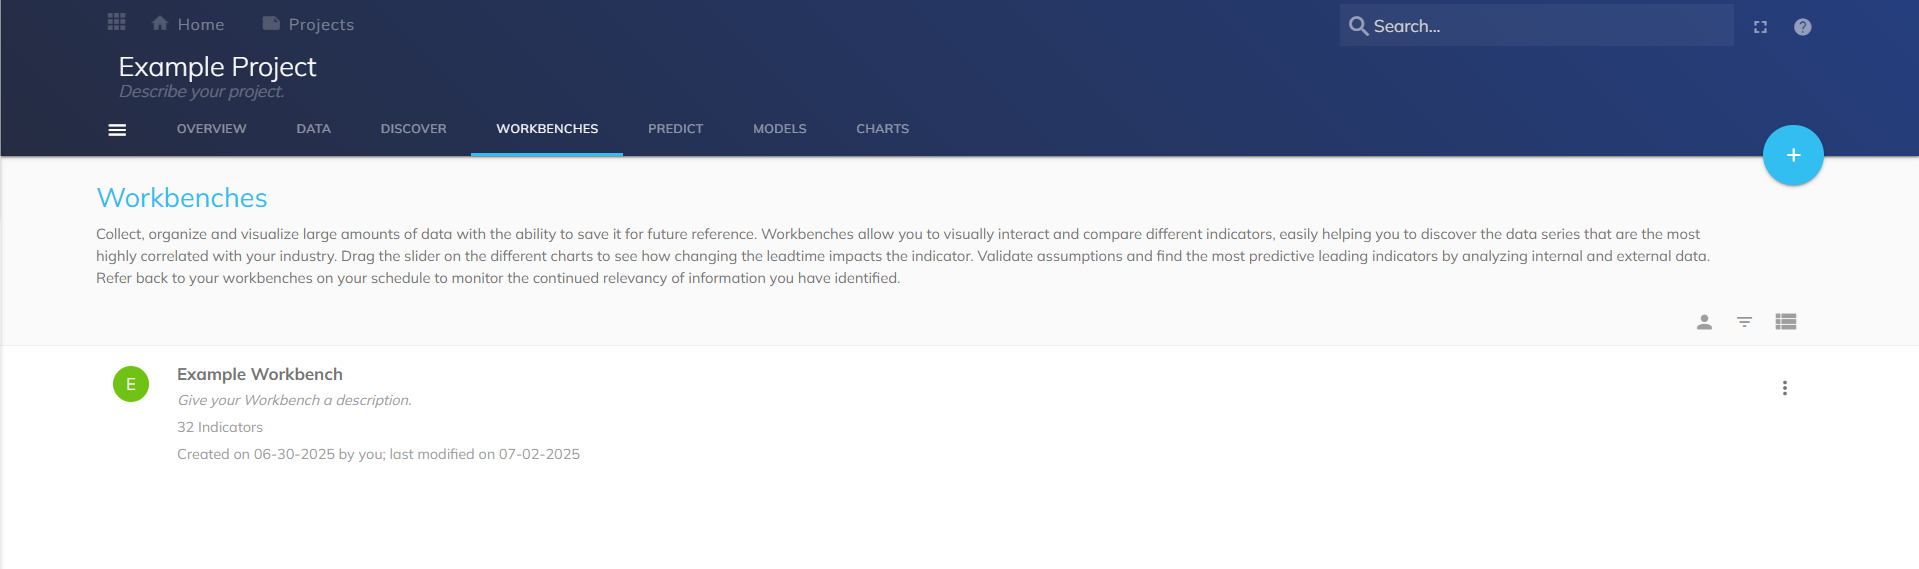
Select a Workbench you want to use as the basis for your Predict job.
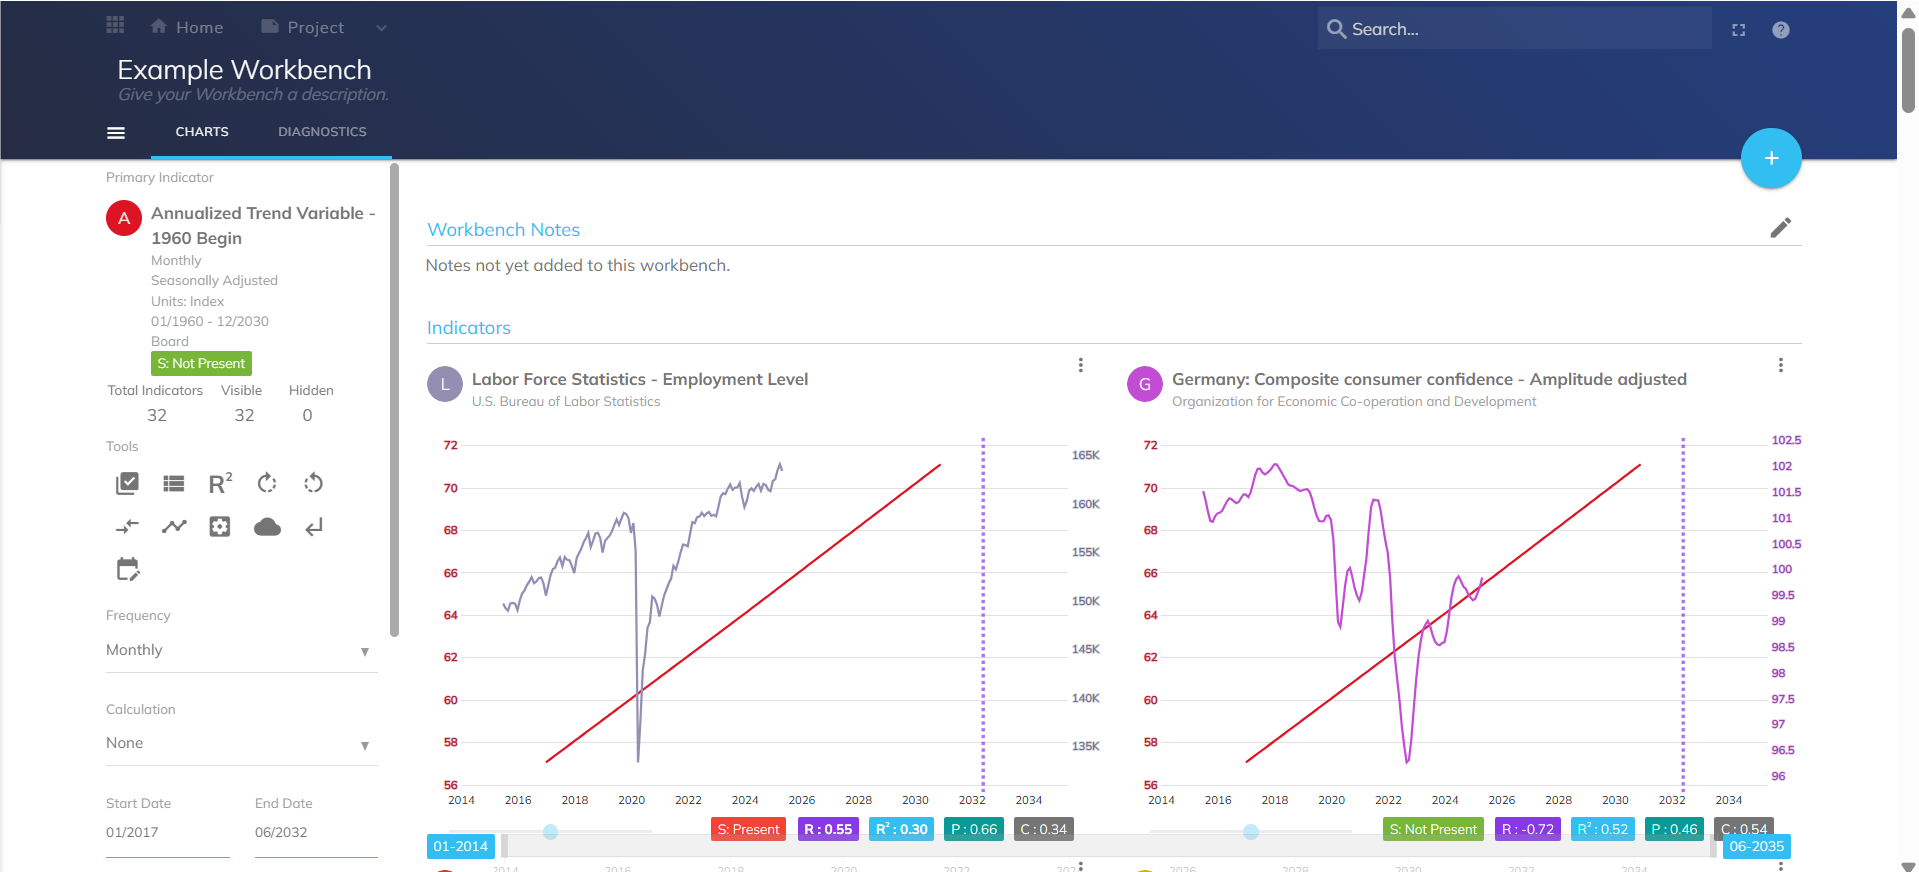
In the workbench, select Create Model icon on the left-hand side.
.png)
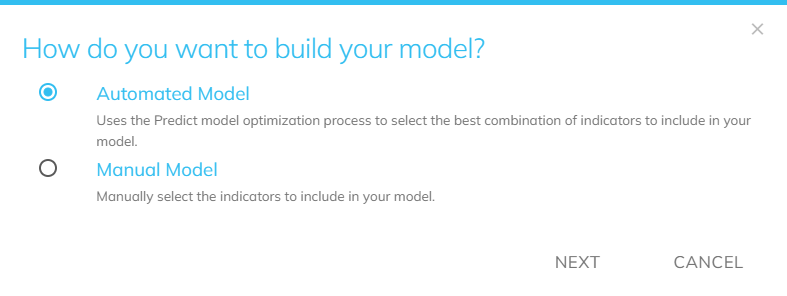
Select Automated Model and click Next.
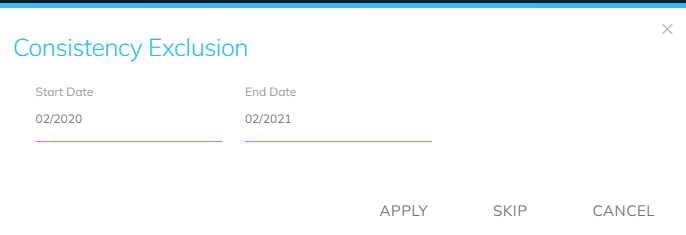
(Optional) Input a Start and End Date for Consistency Exclusion, then select Apply. Select Skip if not required (see Consistency Exclusion and Model Score).
The Predict Job Setup modal appears. Complete the properties:
.png)
Name: Enter a job name.
Target Horizon: Define the forecast timeframe.
Select Indicators: Choose which indicators to include.
Log Option: Available when the Workbench has no calculations. Applies log transformation to all indicators by default (can be unchecked for specific indicators).
Expected Coefficient: Define anticipated relationships between indicators.
Model Period: Set the regression timeframe and select Validate. A validation pop-up appears.
After reviewing the validation, select Run.
A success notification appears in the lower-left corner. Your Predict job is now running.
The Predict Tab
After submission, you can view the Predict job on the Predict tab.
In Progress – Job is running.
Completed – Results are available.
Reviewing Predict Results
Results Page
The Results page provides:
A ranked list of up to 250 models.
Model score outputs, statistics, and indicator makeup.
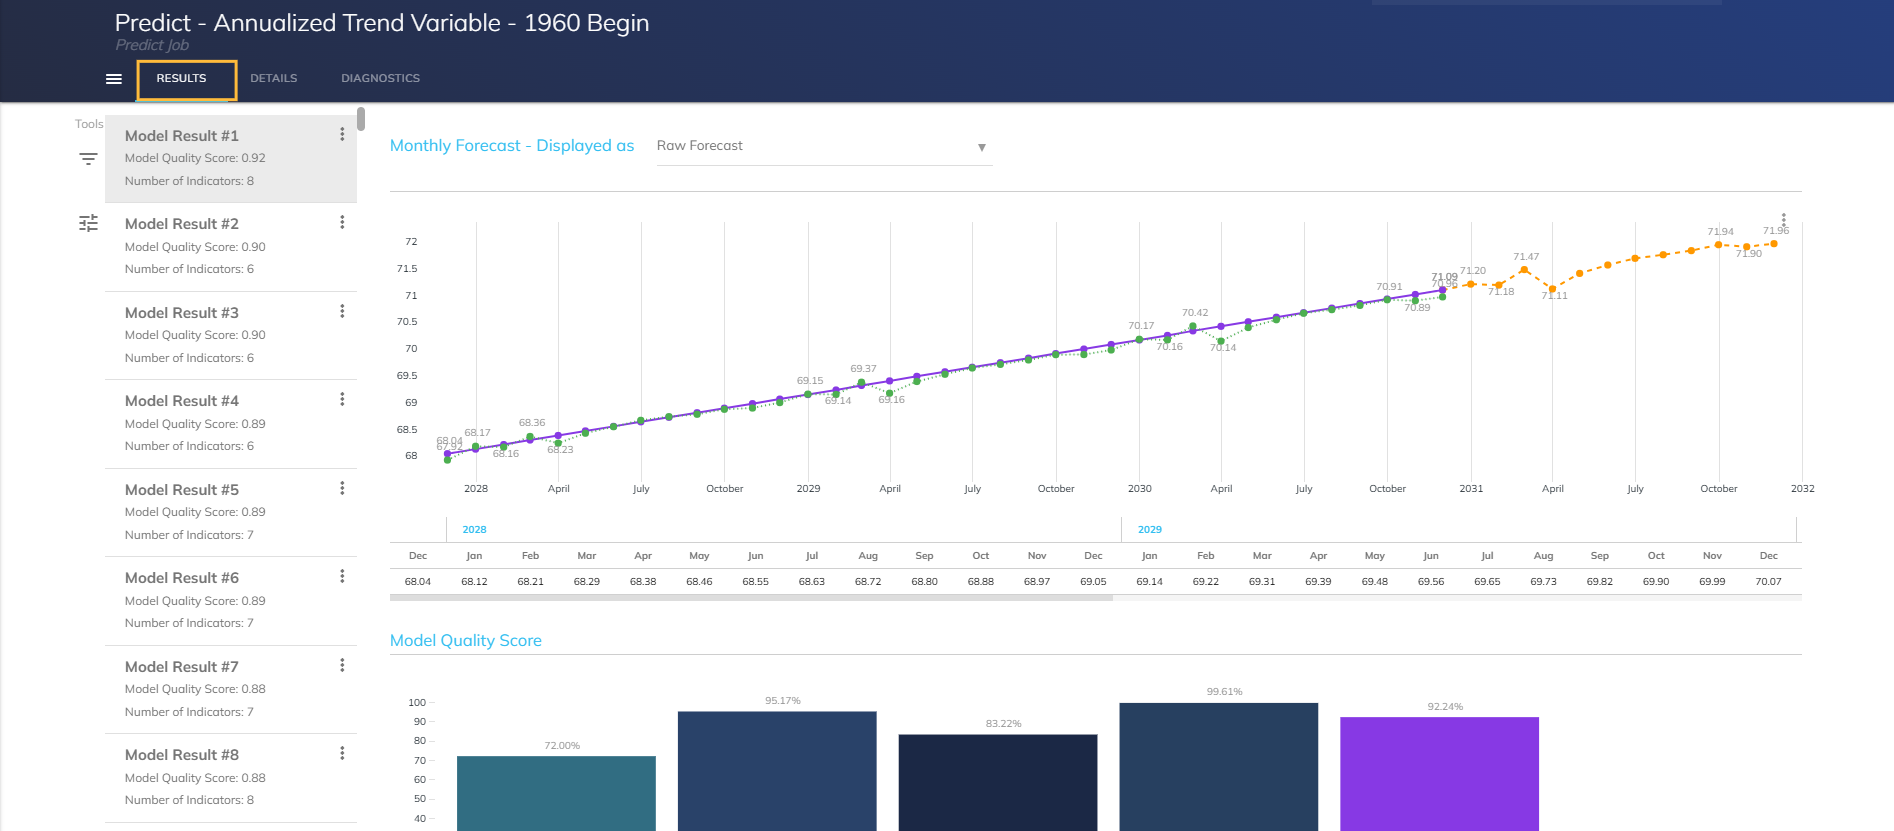
Monthly Forecast Display
Choose how your monthly forecast is displayed:
Raw Forecast
Period/Period Forecast
Year/Year Forecast
Three Period Year/Year Forecast
Statistics
View the statistics of your Predict job. See Glossary of Terms for further definitions.
Model Quality Score (each 4 sub-component + Model Score)
Correlation Matrix
View a table used to analyze the relationships between different indicators within your model. This matrix assists in identifying which indicators may serve as useful predictors and how to adjust the model accordingly based on their interdependence.
Filter
Filter by selected indicators.
Filter by Indicator. View your model results by selected indicators.
Filter by Number of Indicators. View your model results by the number of selected indicators. Results will be filtered to show only models with indicators greater or equal to filter value. Valid values: 1-13. Ranges are not accepted.
Export to CSV
Download your Predict job results to CSV for additional sorting:
Selecting a Model
Show how to select a model, enter name/description.
Details Page
The details page provides information on the Predict run specification, such as the workbench indicators and their relationships/offsets, and the forecast horizon.
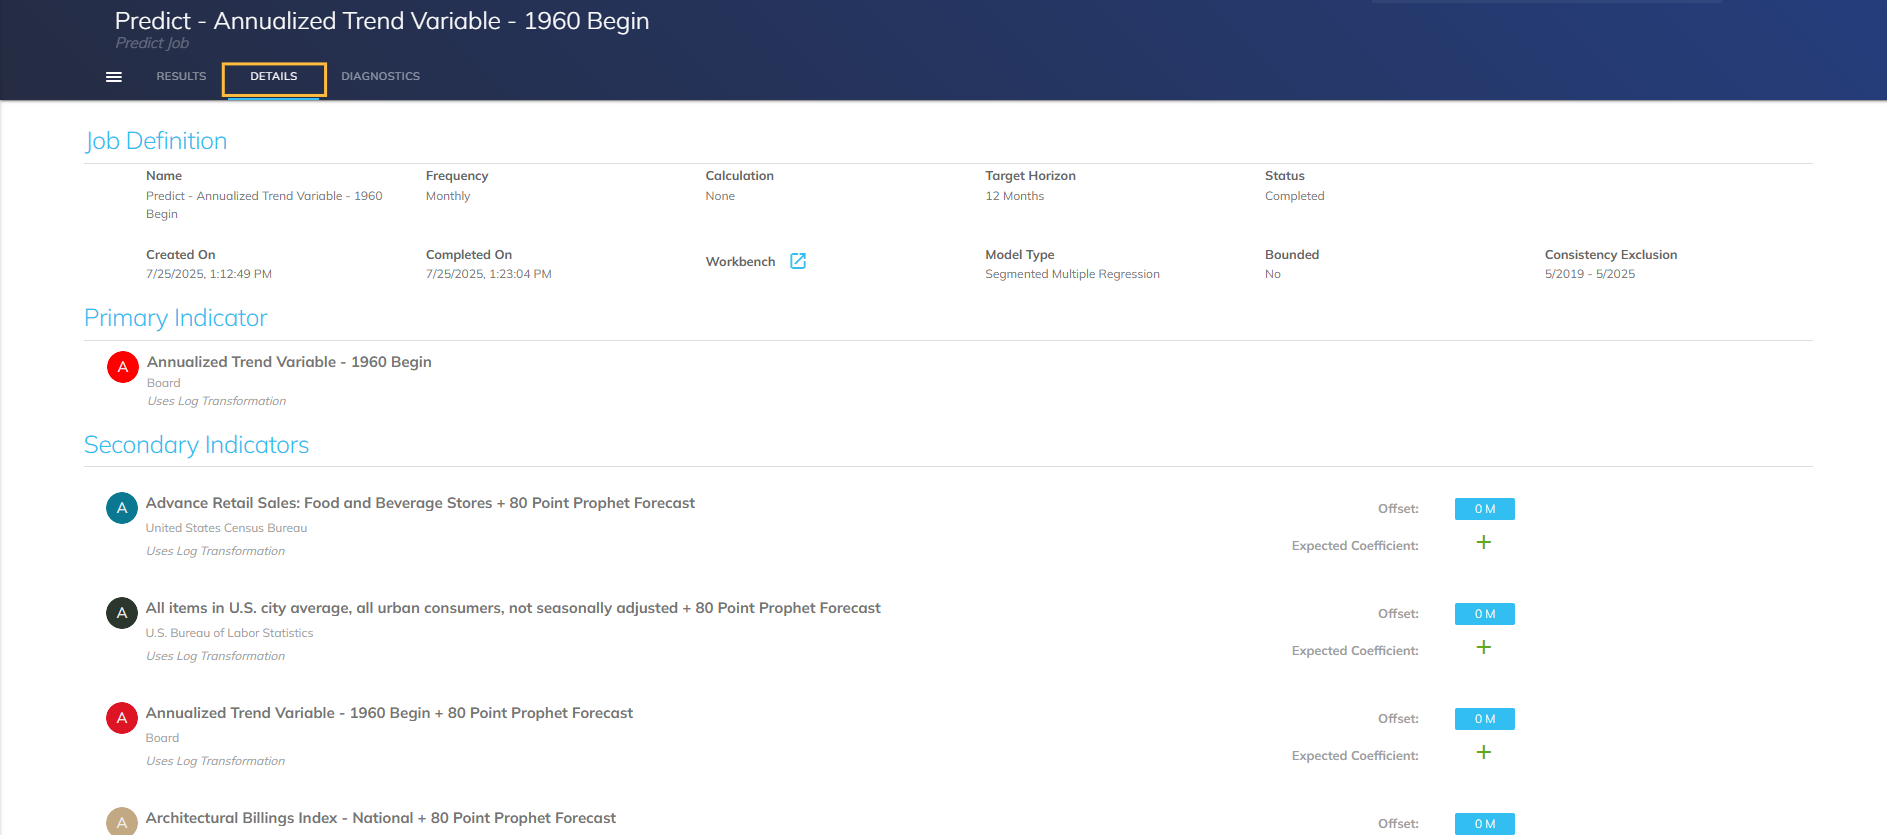
Job Definition: View the details of your primary job.
Primary Indicator: View your primary indicator.
Second Indicators: View your secondary indicators
Diagnostics Page
The Diagnostics page provides high-level information on the model output.
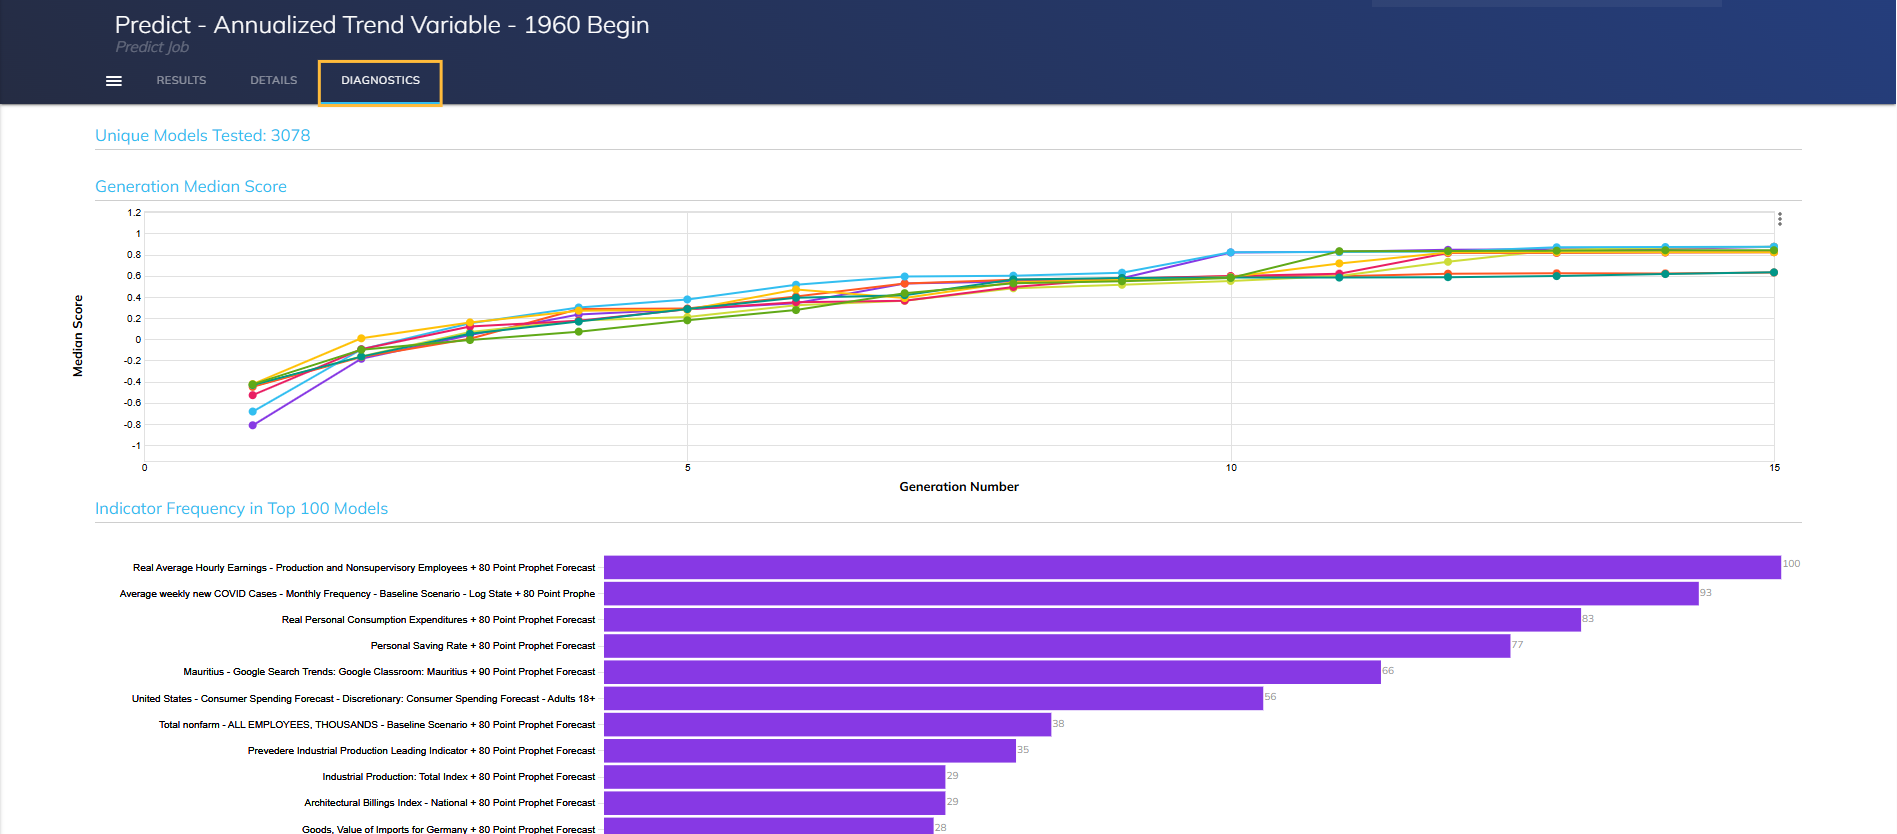
Unique Models Tested: View the number of unique models tested.
Generation Median Score: View the median model score through each GA iteration.
Manage Datasets: Toggle the visibility of the parallels of your dataset.
Indicator Frequency in Top 100 Models: View the indicator frequency in the top 100 models.