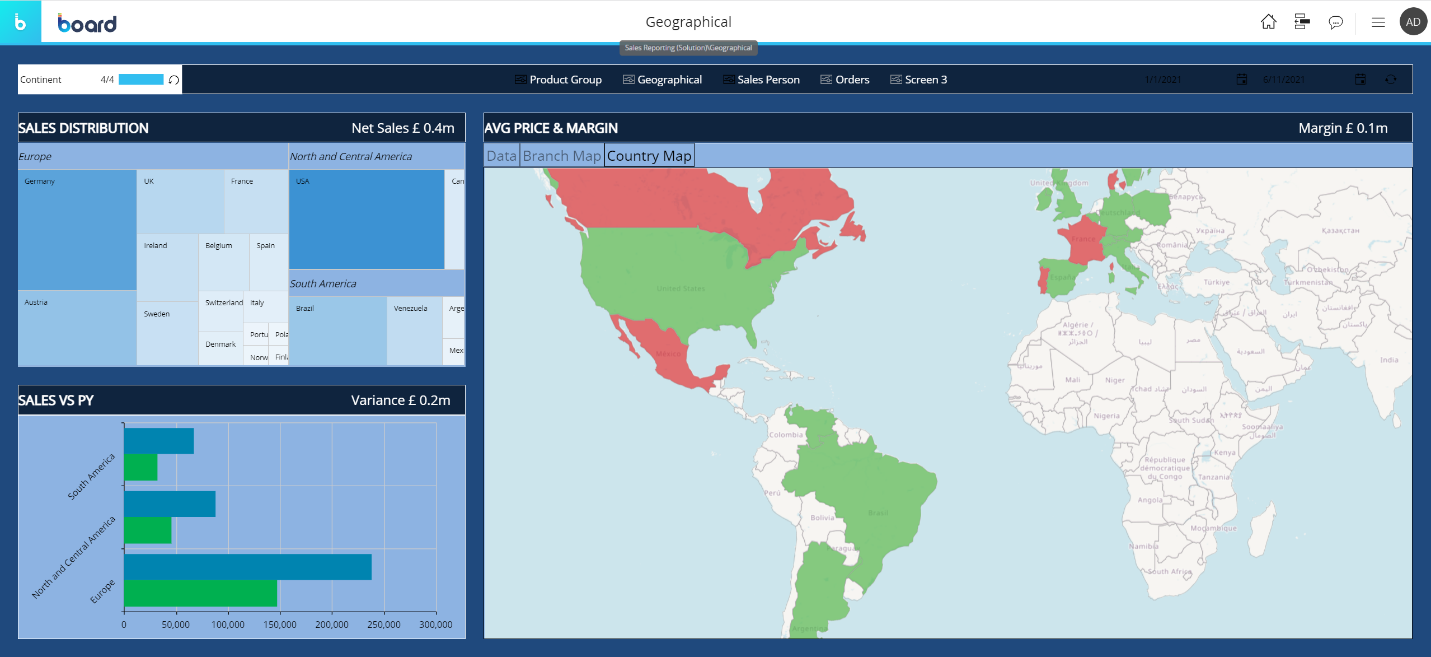
The OpenStreetMap Object gives you the ability to display multidimensional data on an interactive map. This Object provides at a glance information about geographic trends and distribution patterns by using markers, color conditional formatting, and colored map areas.
It can display geographic data as:
Map Areas, which display values as colored geographic areas, such as countries, regions, provinces, or other defined territories.
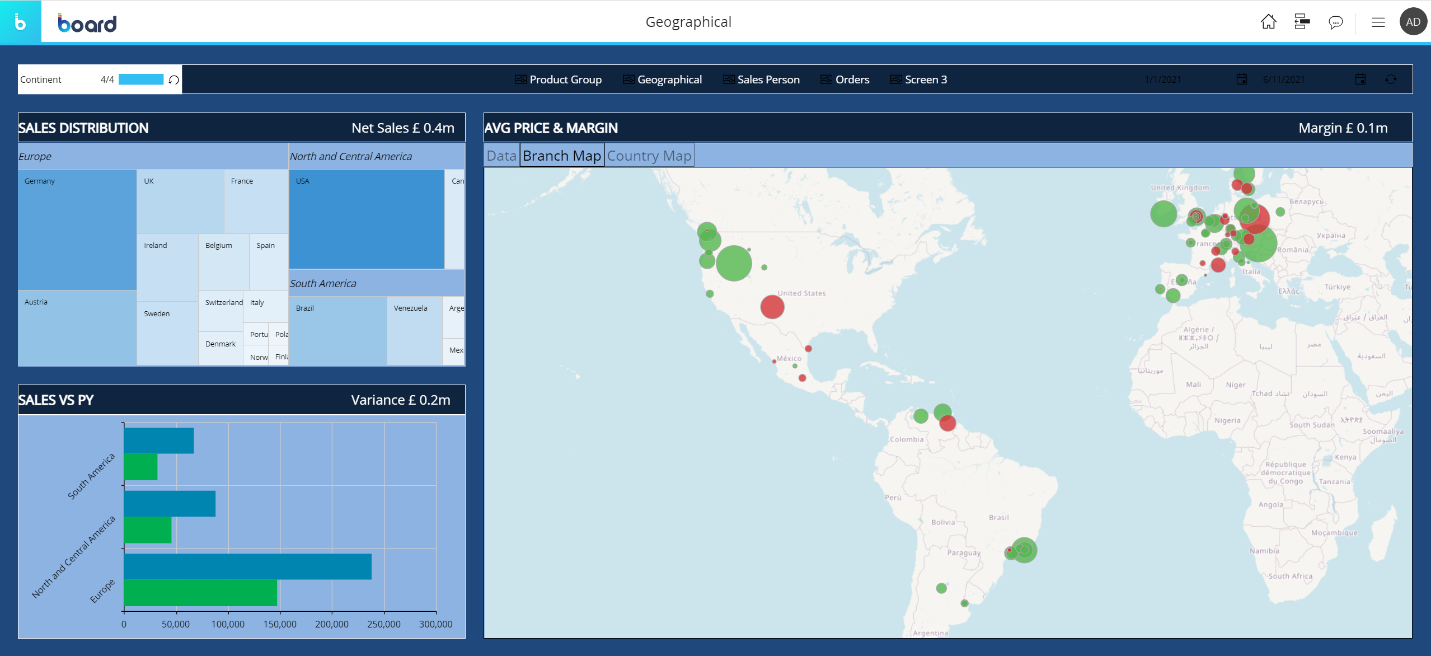
Bubbles, which display values as points on the map using Latitude and Longitude values.
Based on your data, Board automatically calculates the size of markers, and their color can be dynamically configured or customized according to your preferences. The OpenStreetMap Object supports up to 20 different zoom detail levels.
Examples
The following picture shows an OpenStreetMap Object with markers whose area represents Net Sales and color conditional formatting set on a target value.
The following picture shows an OpenStreetMap Object with color conditional formatting set on a target value and applied to map areas (countries).