This section describes how to get started with Board Foresight and how it integrates with Board. It introduces the basic concepts and guides you through the initial steps required to access Foresight, manage projects, exchange data with Board, and bring Foresight data into a Board Data Model.
This article covers:
How to log in to Board Foresight
What a project is
How to sync Board data with Foresight
How to add Foresight data to a Board Data Model
Log in to Board Foresight
You can access Board Foresight in one of the following ways:
By logging in directly using single sign-on (SSO)
By launching Foresight directly from a Board Data Model, if you are a Board Developer.
Log in using SSO
Navigate to: https://app.prevedere.com/
Enter your email address and click “Next”.
You will be redirected to Board to complete the login using your password.
.png)
Click “Log In” to access the Board Foresight Projects homepage.
Launch Foresight from Board
In a Board Data Model, navigate to Data Structures and select “Economic Indicators”.
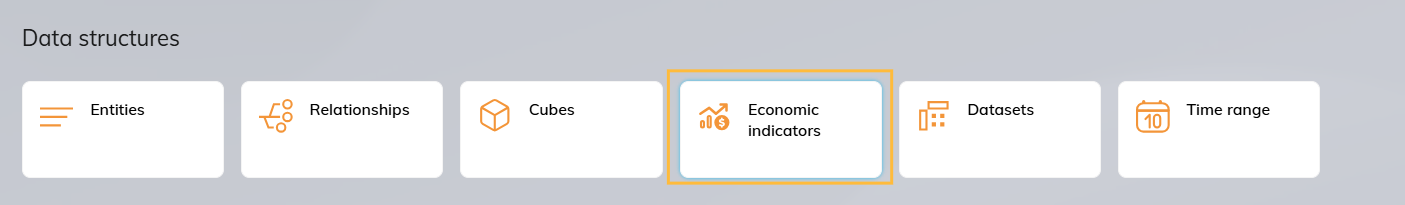
Select “Go To Foresight”
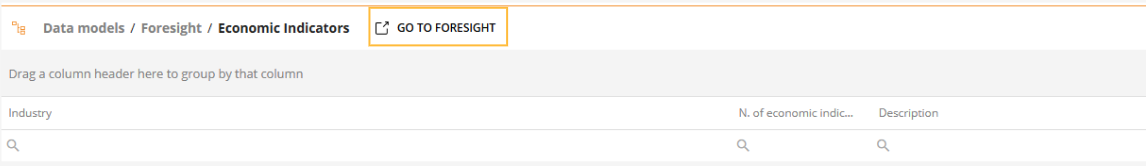
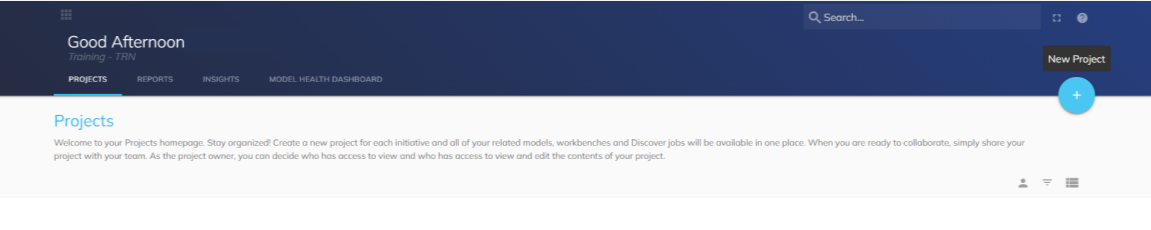
After redirection, you will land on the Board Foresight Projects homepage.
Projects
What is a project?
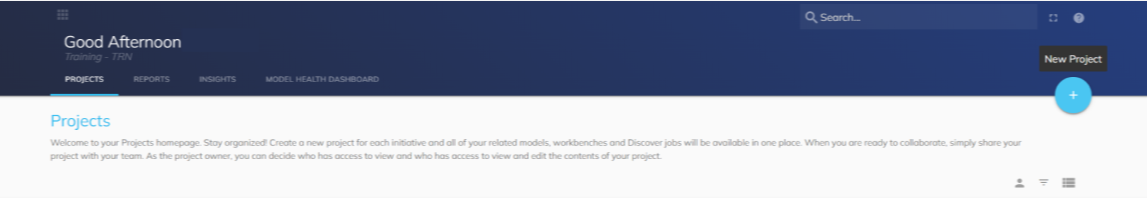
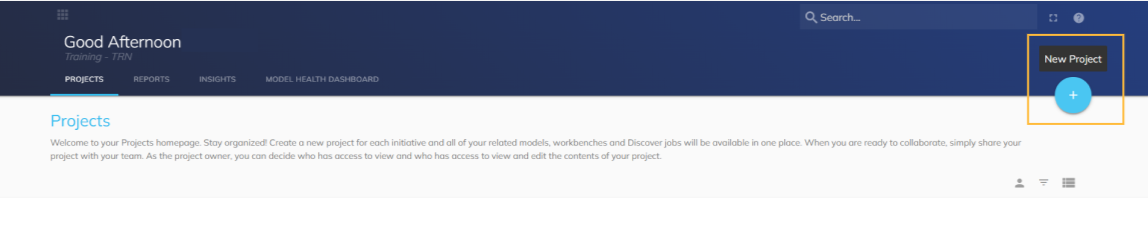
After logging in, you are taken to the Projects homepage. This page serves as the central workspace for creating, organizing, and managing workflows within Board Foresight.
From the Projects homepage, you can access:
The Foresight Discover engine
Workbenches
Forecast models
Jobs
All project-related content is managed from this single location.
The Projects homepage also includes tools that help you organize and locate your work efficiently:
.png) Filter. Enter keywords to narrow down the list and quickly find specific projects or workflows.
Filter. Enter keywords to narrow down the list and quickly find specific projects or workflows..png) Condense/Expand. Toggle between a simplified and a detailed view of project descriptions to better manage your workspace.
Condense/Expand. Toggle between a simplified and a detailed view of project descriptions to better manage your workspace.
As a project owner, you can also control which users have permission to view or edit project content.
Create a project
On the Projects homepage, click on the “New Project” icon in the top-right corner of the page.
In the New Project modal that appears, enter the Project Name and Description.
There are no character limits for either field.
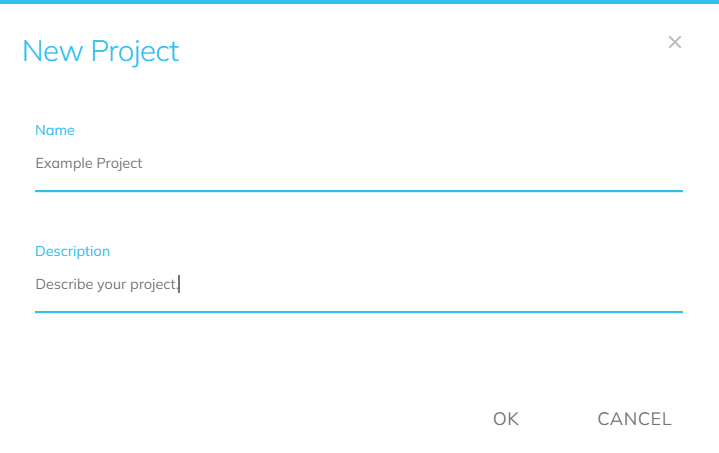
Click “OK” to create the project.
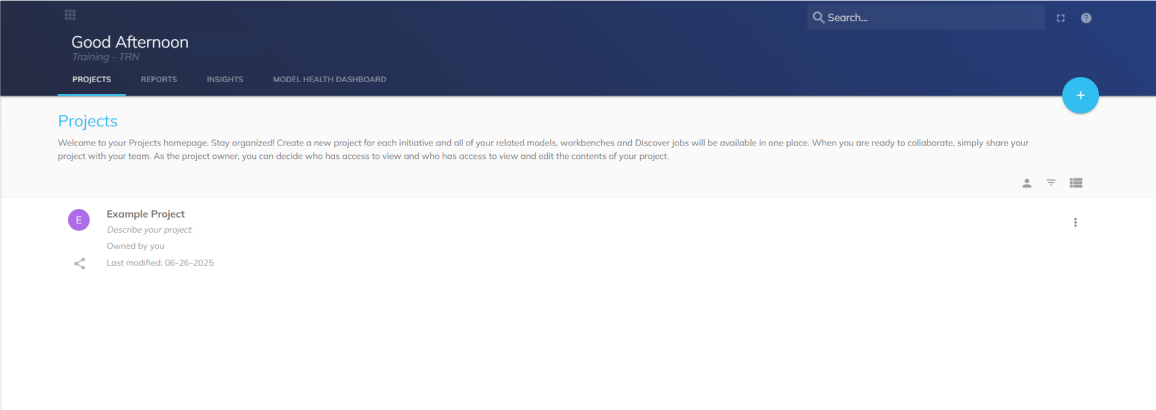
The new project is now available on the Projects homepage.
Sync Board data in Foresight
💡In versions 14.4 and earlier, indicators cannot be created in Board Foresight directly from existing Datasets.
You can create indicators directly from existing Datasets. To enable a Dataset for data exchange with Foresight, the Dataset must meet the following requirements:
Dataset requirements
Data Blocks
The Dataset must contain at least one numeric Cube
Multiple Cubes are supported
Supported data types include: Single, Double, Integer, and Currency.
Axes
A Time Entity is required
Data is ingested into Foresight at the highest available time frequency
For example, if both Month and Day Time Entities exist, data is loaded at the daily level.
Import a Dataset into Foresight
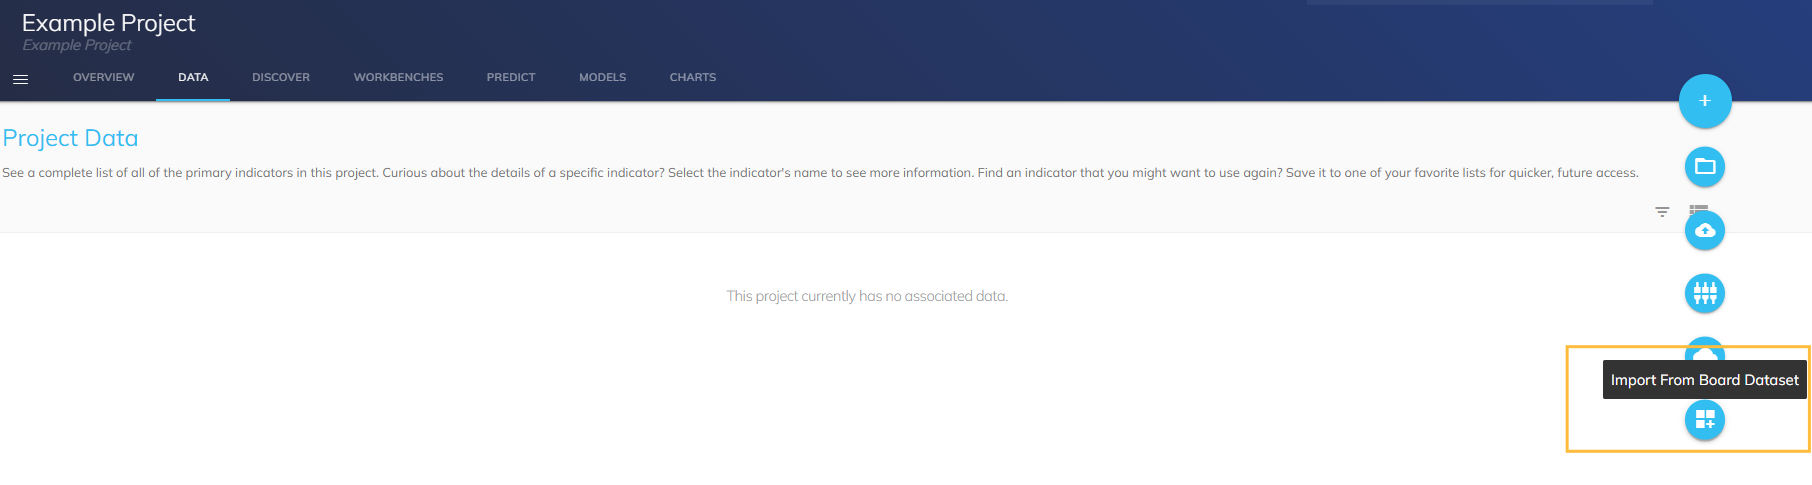
From the Project Data page, you can import Board Datasets to create indicators.
Navigate to the Project Data page in Foresight.
Click “Import from Board Dataset” to begin importing data into your project.
Select Dataset
The Select Dataset modal appears, listing the Datasets you have access to.
.png)
Select the Dataset you want to import and click “Next”.
If the Dataset contains multiple numeric Cubes, an additional dropdown appears. You must select one Cube before proceeding.
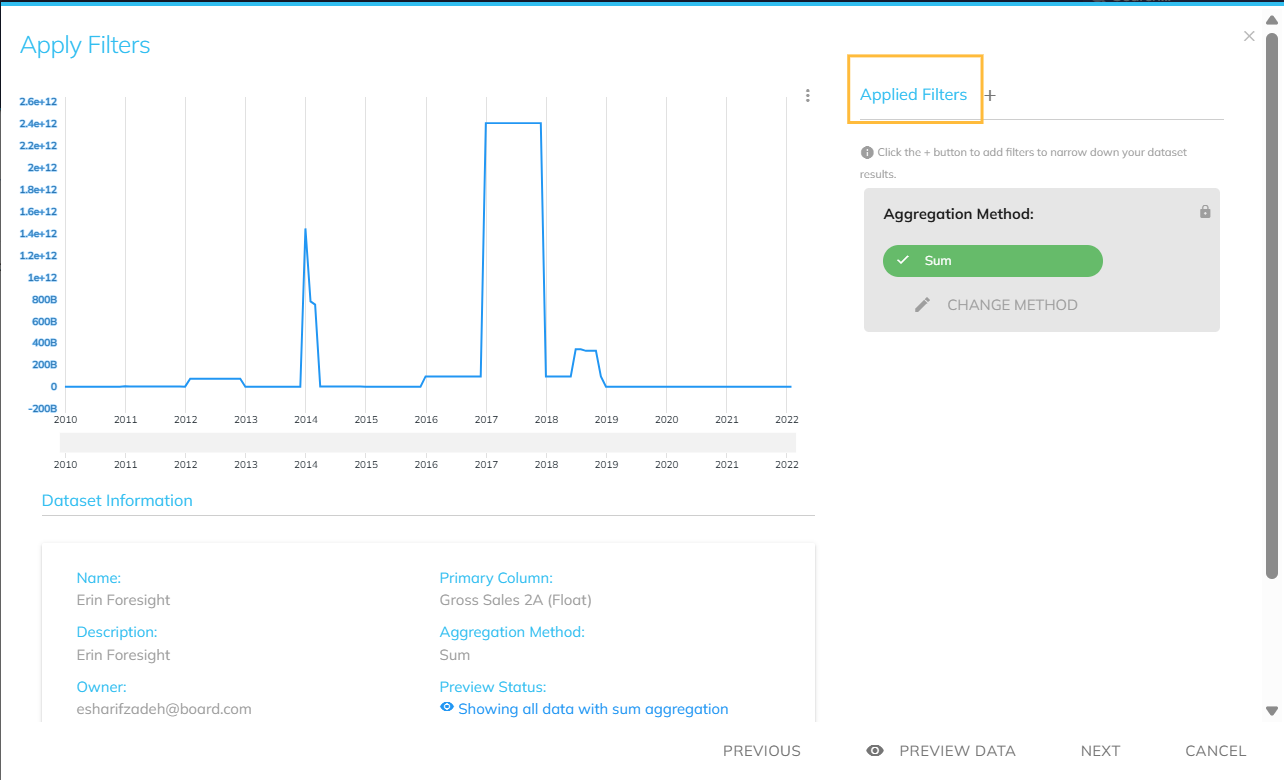
Review and preview data
Review the aggregation method, then click on “Confirm”.
.png)
Click “Preview Data” to view a sample of the imported Dataset.
A preview of the data is displayed. You can use the Applied Filters to narrow the data if needed.
Create Indicator
After applying filters (if required), click “Next” to open the Create Indicator screen.
Review and complete the form, and then click on “Create Indicator”.
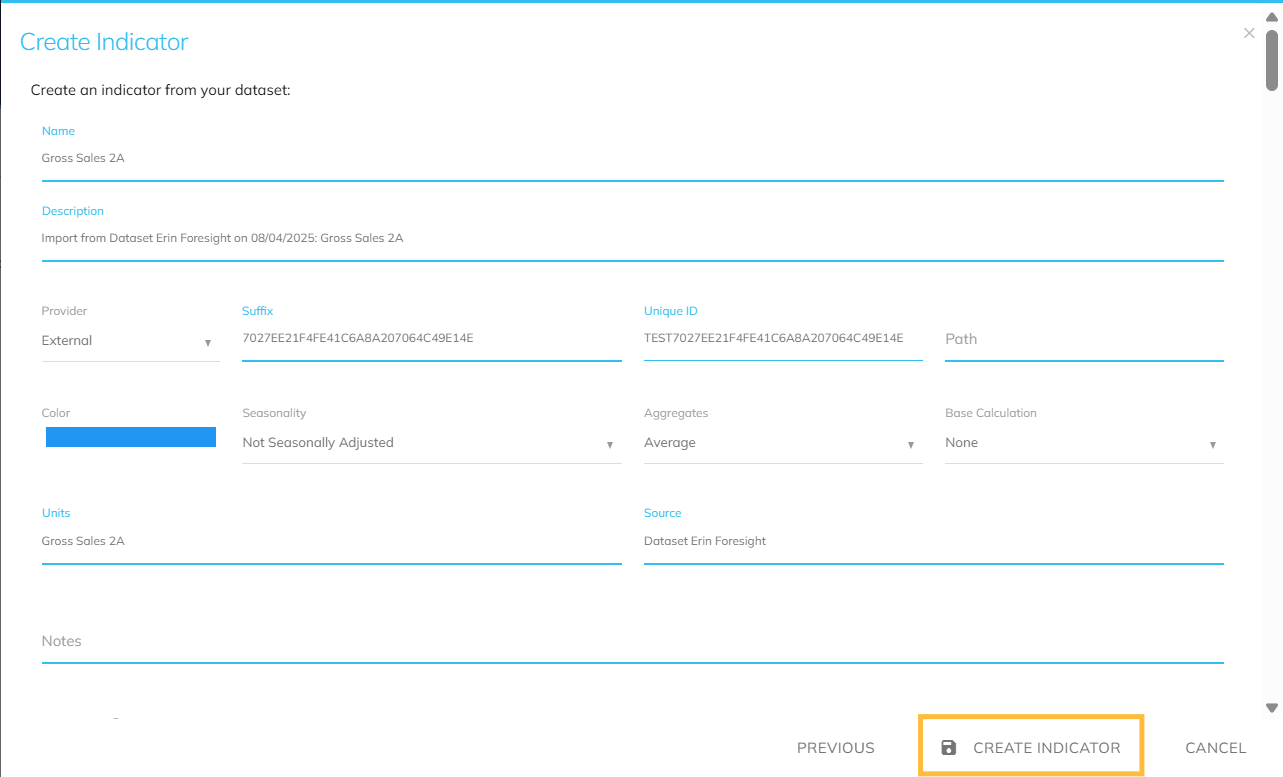
Form Properties
Name. Defaults to the Cube name.
Description. Defaults to the import details, including Dataset name, import date, and Cube name.
Aggregates. Defaults to the aggregation method selected during import.
Units. Defaults to the Cube name.
Source. Defaults to the Dataset name.
The Board Dataset is now successfully uploaded and available as an indicator in Foresight.
Add Foresight data to a Board Data Model
Once a forecast has been created or indicators have been selected from the Global Intelligence Cloud, Foresight provides several ways to send that data to a Board Data Model.
Only Data Models that you have access to are available for selection.
Send data from an Indicator page
Foresight enables users to send indicator data directly from the Indicator page to a Board Data Model. The system automatically creates the required Cube in the selected Data Model, making the data immediately available for use in Board Capsules and Screens.
Navigate to the Indicator page.
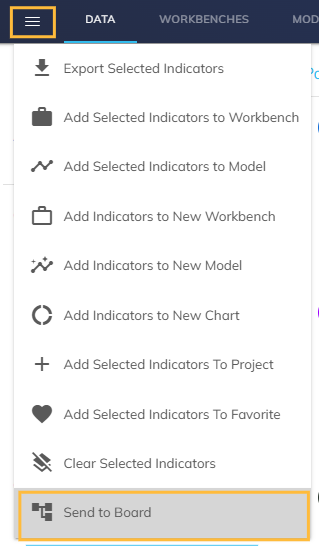
Open the hamburger menu and select “Send to Board”.
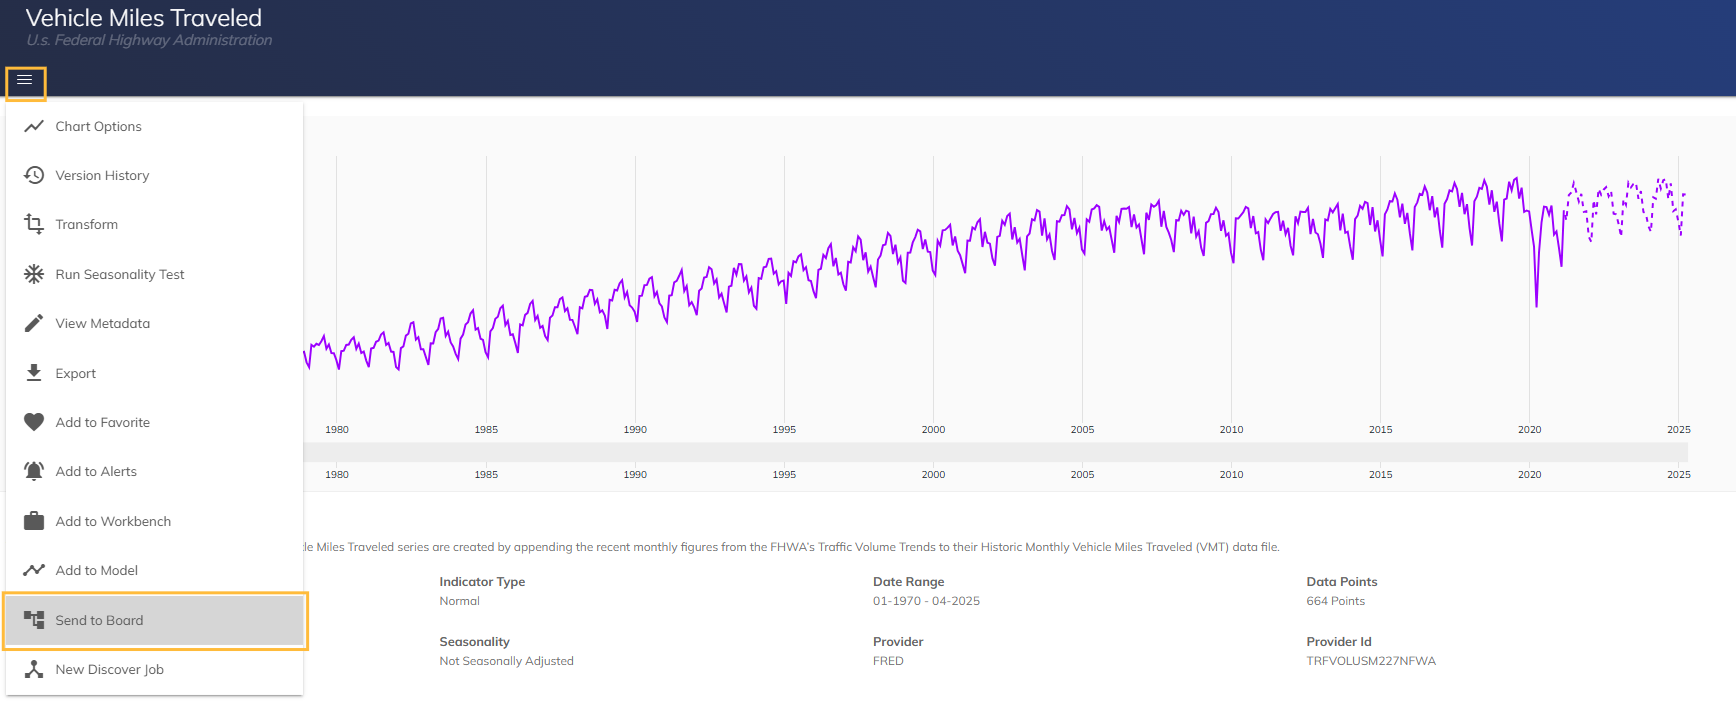
In the modal, select a Board Data Model from the list of available Data Models and click OK to continue.
.png)
A confirmation message appears in the lower-left corner of the screen: “Indicator sent to Board successfully.”
.png)
A Cube is automatically be created in the selected Board Data Model and becomes available for use in Capsules and Screens.
.png)
Global Intelligence Cloud (GIC)
The Global Intelligence Cloud (GIC) provides access to a broad range of global datasets collected, cleaned, and regularly updated from multiple sources. Data is organized using a tagging system, making it easier to identify relevant indicators by business focus, industry, or region.
Add a single indicator
Open a kebab menu for the selected indicator.
Select “Send to Board”.
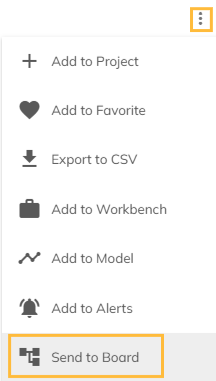
Select a Board Data Model from the list of available Data Models and click “OK” to continue.
A success message confirms the action, and a Cube is created in the selected Data Model.
Add multiple indicators
In the GIC, use the checkboxes to select one or more indicators.
Open the hamburger menu and select “Send to Board”.
Select a Board Data Model from the list of available Data Models and click “OK” to continue.
All selected indicators are sent to Board, and corresponding Cubes are created.
Send data from Workbenches
Workbenches allow you to collect, organize, and visualize large volumes of data to analyze relationships between a primary variable and secondary indicators.
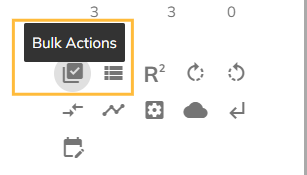
On a Workbench, click “Bulk Actions” in the left-hand toolkit.
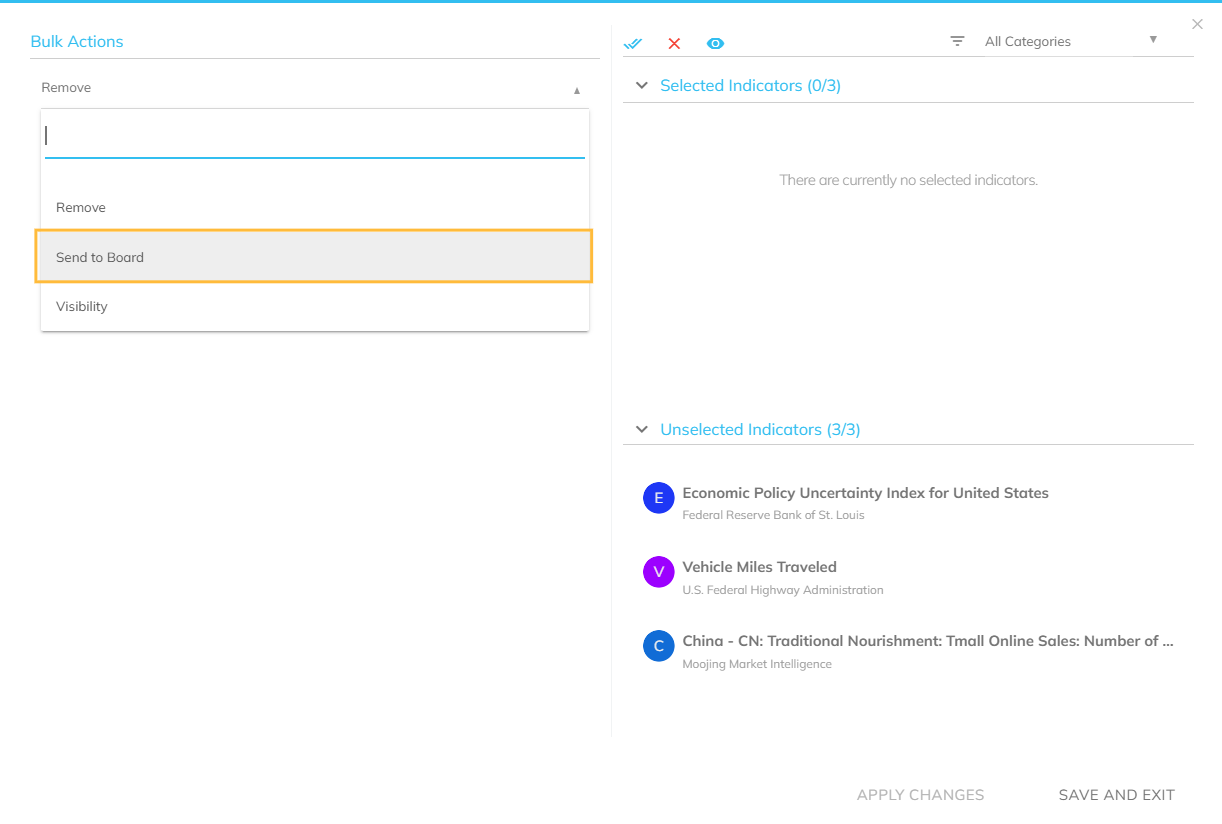
In the Bulk Actions modal, select “Send to Board” from the left panel.
From the second dropdown, select a Data Model.
Select the indicators to send.
Selected indicators move from Unselected Indicators to Selected Indicators.
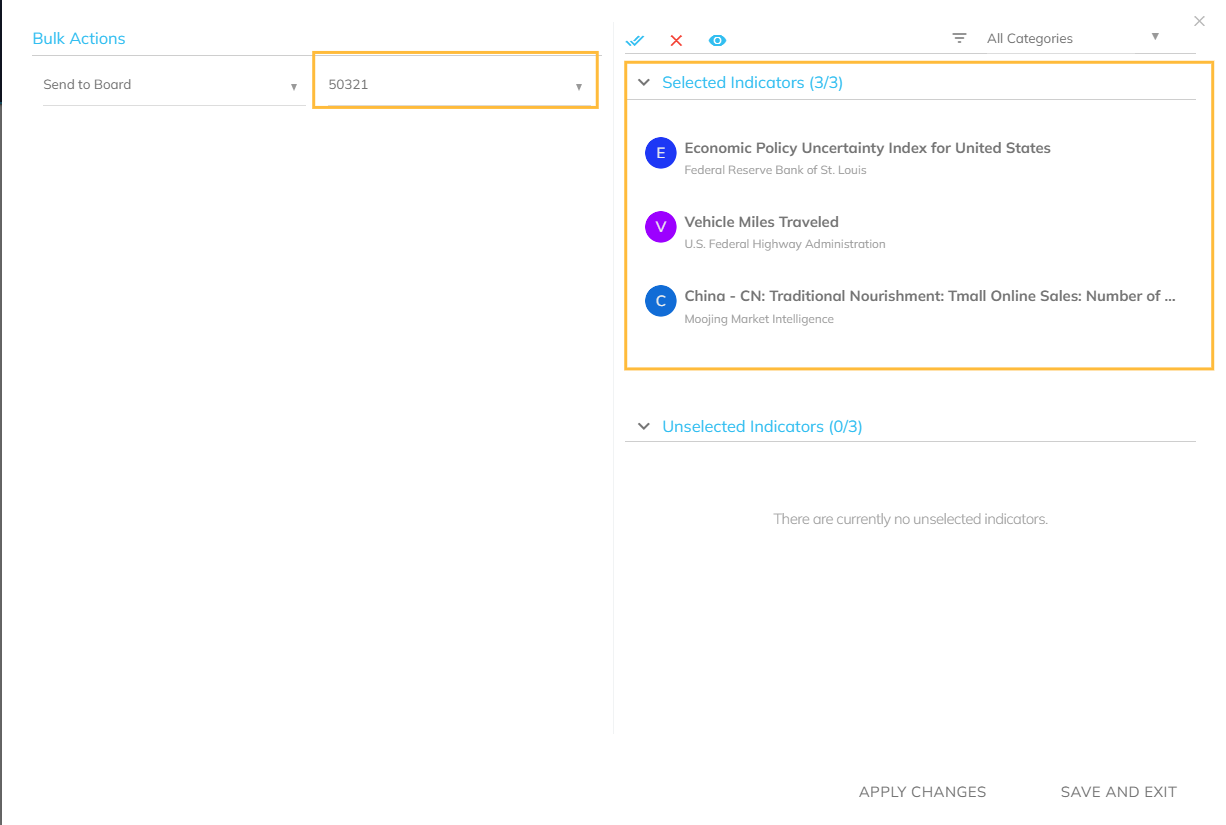
Choose one of the following options:
Apply Changes. Executes the action and keeps the modal open so you can perform additional bulk actions.
Save and Exit. Executes the action and closes the modal.
In both cases, a success notification appears in the lower-left corner of the screen.
.png)