This topic covers how to create different Objects and configure their Layouts within the Board Word Add-in. After installing and establishing a connection to Board, you can now successfully add a Layout using the Board Excel Add-in.
The Layout has similar functions and follows the same rules, restrictions, and logic as the Board Platform Layout, however, it looks a little different.
The Board Word Add-in has 7 Objects in its Toolbox that can be added and configured in a Word document.
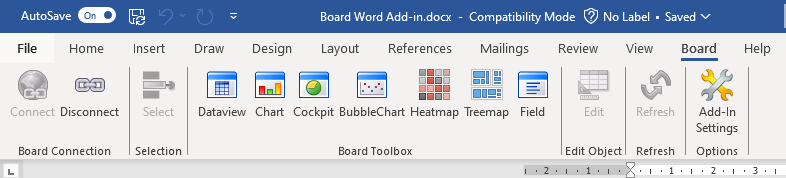
Dataview. Displays data in a Data View Object.
Chart. Displays data in a Cartesian line chart.
Cockpit. Displays data with a gauge icon for each member of the Entity that is defined in its Axes of the Layout.
BubbleChart. Displays data in a bubble chart.
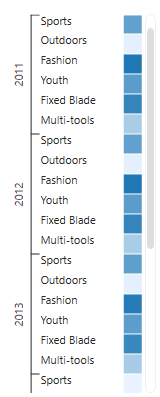
Heatmap. Displays data in a Heatmap.
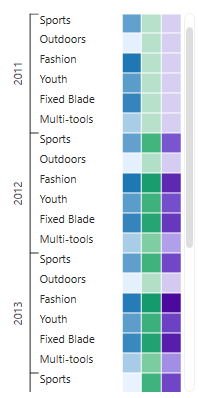
Treemap. Displays data in a Treemap.
Field. Displays a specific data point as defined by the Layout.
To create one of the above Objects, proceed as followed:
Open the Layout Editor by clicking on an Object button in the Board Toolbox at the top of the Word document. The way to enter the Layout editor depends on the Object. The Dataview and Field Objects immediately open the Layout Editor.
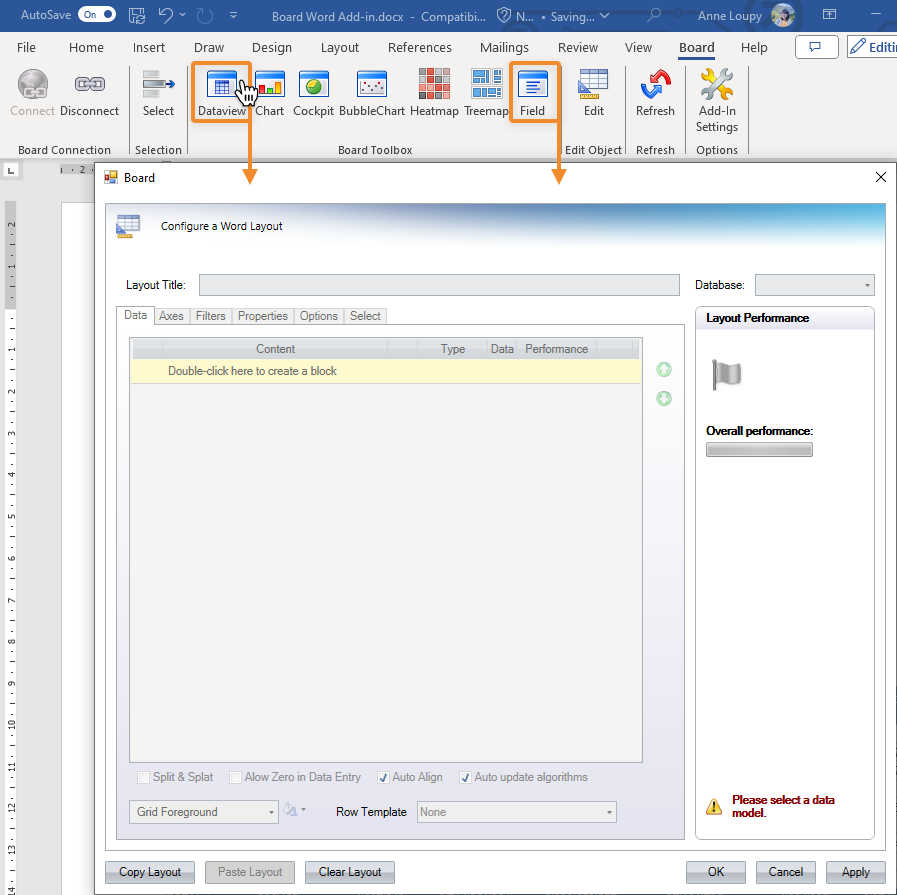
All other Objects (Chart, Cockpit, BubbleChart, Heatmap, and Treemap) open the Component Designer window, in which you must right click inside the editing area to reveal the right-click menu and select "Layout" to open the Layout Editor.
Choose a Data model from the Database dropdown menu in which you want to use to configure the Layout.
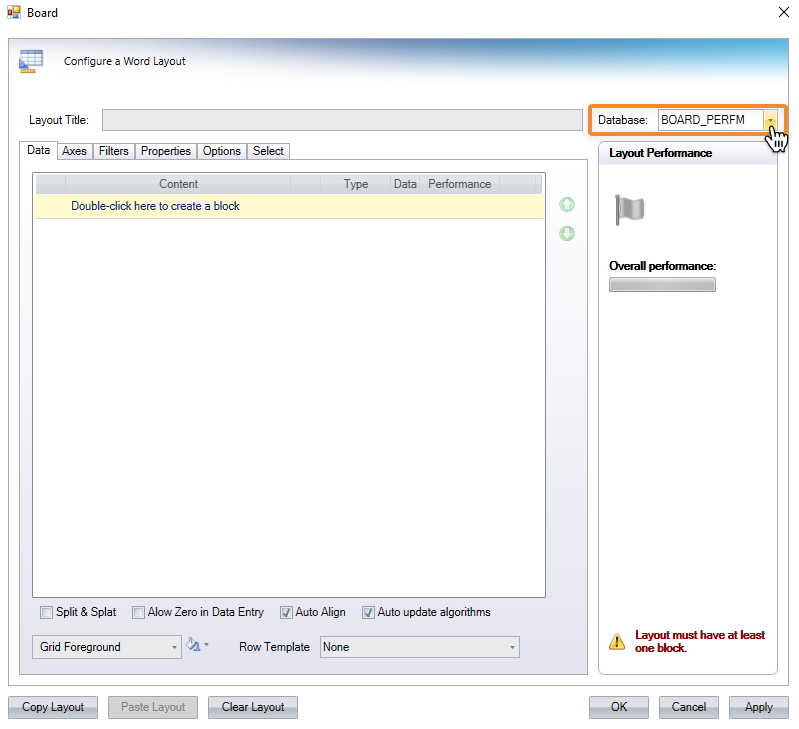
Add a Data Block by double clicking the yellow cell in the Data area that says "Double-click here to create a block". This will open the "Configure a Block" window where you can add a Data Block and configure its settings.
From this window, you see 7 tabs available, the first of which is open by default and named "Setup".
Here, you can add a Data Block from the first option "Data Selection" by using the dropdown menu and selecting a Block.Add/adjust settings, options, and formatting to the Block (optional). Read more about Block settings in a Microsoft Add-in Layout.
Click OK to return to the Layout Editor.
Dimension the Layout. Select the Axes tab to configure the Layout with the Entities by row and/or column. Drag and drop the Entities in the list on the left-hand side into the By Row and By Column areas, depending on the Object and configure the Layout settings
For Charts, the Axes area works similarly to the Layout in the Board Platform. Although the Axes' names do not change in the Add-in Layout Editor, you can refer to the following:By Row = Categories
By Column= Series
Cockpit, BubbleChart, and Treemap only allow Entities set By Row.
Layout Options in Board Word Add-in
The Options area of every Object is different. Read about the different Options section for each Object:
The Word Add-in Field Object does not have an Options section.
Data View Options
Blocks to include in the thumbnails. Displays the Blocks configured in the Data View Layout.
Show as sparkline column. Displays a sparkline chart when enabled.
Block Options. Configures a Drill, on an Entity, Screen, Procedure, or Drill through. The table has the following columns:
Block. Displays the Blocks that have been added to the Layout.
Action. Displays a "Configure" button. Click this button to open the Drill anywhere window where you can configure a Drill. When a Drill is configured, a green dot displays to the right of the Configure button.
Read more about how to configure a Drill on a Data View.Appearance. Choose the Block appearance .
Normal. Appears as usual.
Checkbox. Appears with checkboxes.
Button. Appears with buttons.
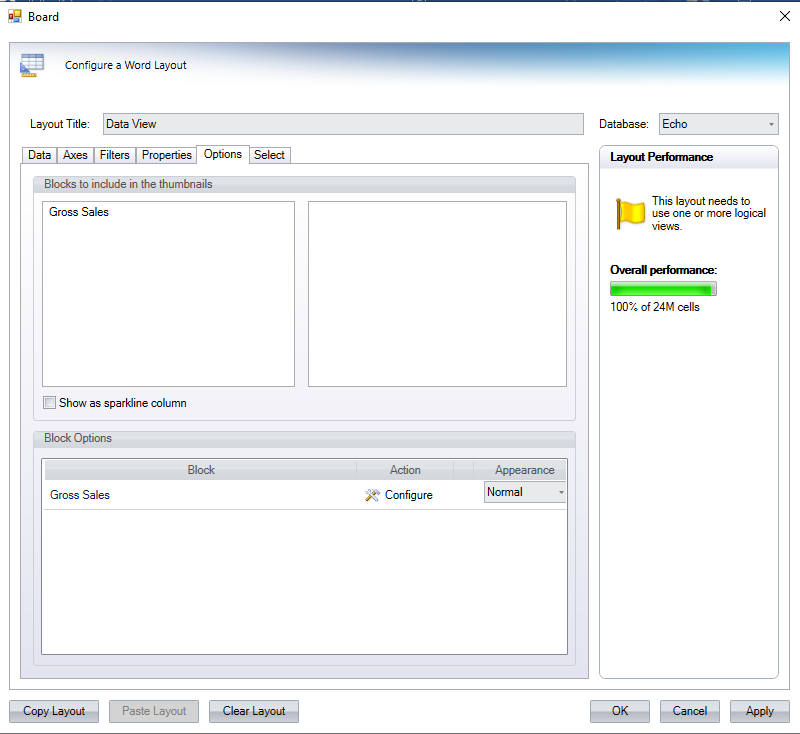
Chart Options
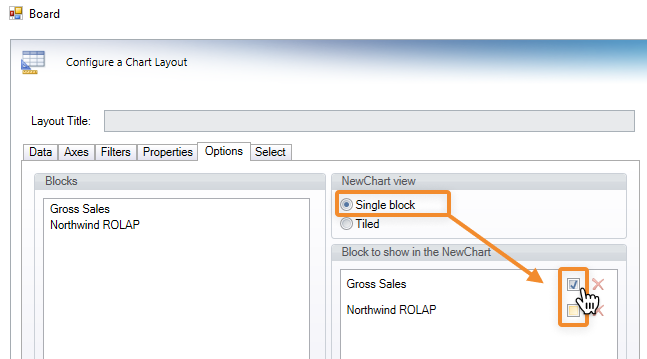
Blocks. Displays the Blocks added to the Layout. Drag and drop these Blocks to the "Block to show in the NewChart" and "Block for series color" areas.
NewChart view. Choose how you want the chart to be displayed with the following options.
Single block. Multiple Blocks stacked, clustered or as different types: enable this option to view all Blocks at once on a single Chart. You can select which Block you want to display by selecting the Block-specific checkbox that appears next to the existing Blocks in the "Block to show in the NewChart" area.
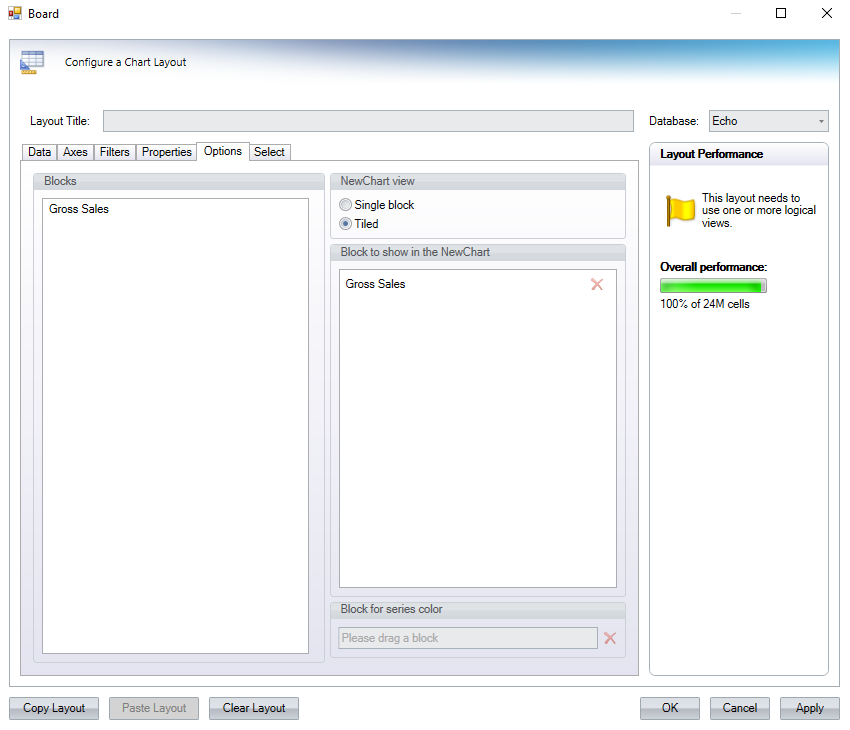
Tiled. Enable this option to view each Block in the Layout.
Block to show in the NewChart. Displays the Blocks listed here. Remove Blocks by clicking the red X, and add Blocks by dragging them from the Blocks section and dragging them to this area.
Block for series color. Applies a color alert (already configured in a Block's settings) for the chart background. The color alert will be driven by the values of the selected Block and the chart background color will change accordingly.
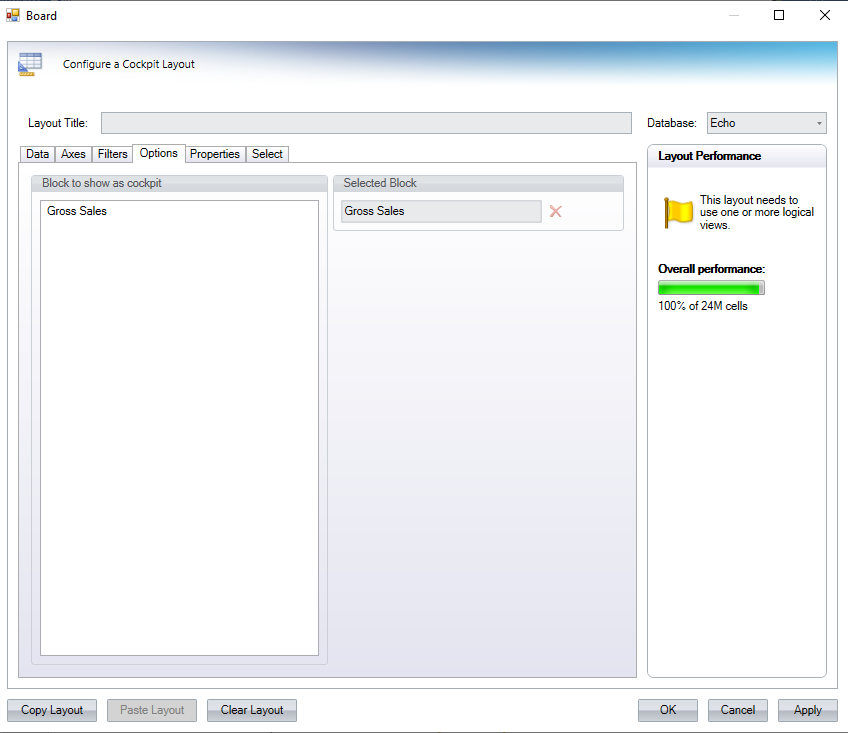
Cockpit Options
Block to show as cockpit. Displays the Blocks added to the Layout.
Selected Block. Displays the selected Block in the Cockpit Object. If more than 1 Block is added to the Layout, drag and drop the Block you want to apply from the "Block to show as cockpit" area. You can only select one Block.
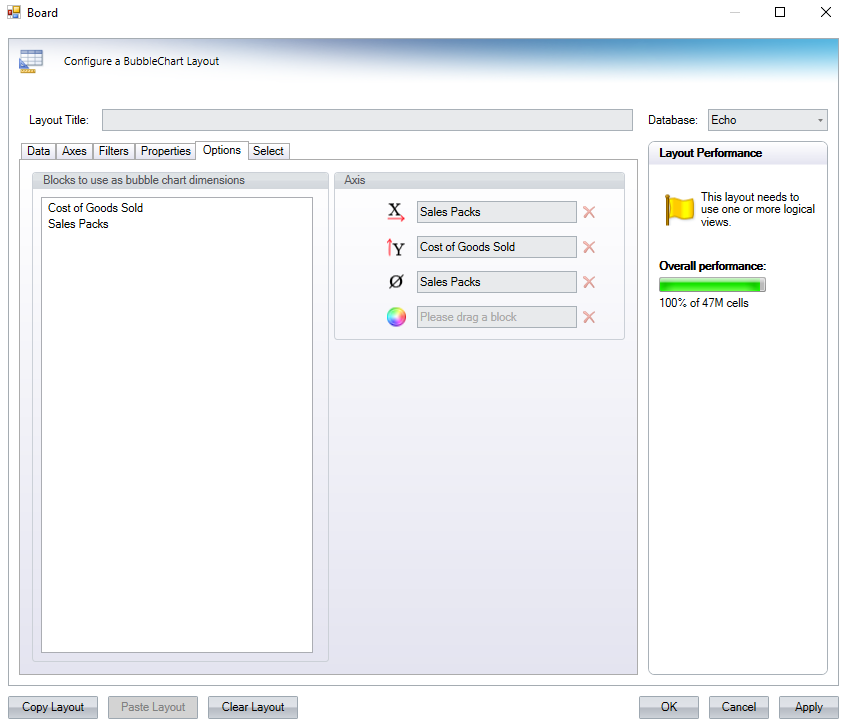
BubbleChart Options
Blocks to use as bubble chart dimensions. Displays the Blocks added to the Layout.
Axis. Defines how the Bubble Chart should be displayed. Drag and drop a Block to each axis option, as described below:
X axis. Assign a Block to the chart's X axis.
Y axis. Assign a Block to the chart's Y axis.
Radius. Choose a Block that will be used as a driver for the bubbles' radius.
Color. Choose a Block that will be used as a driver for the bubbles' color.
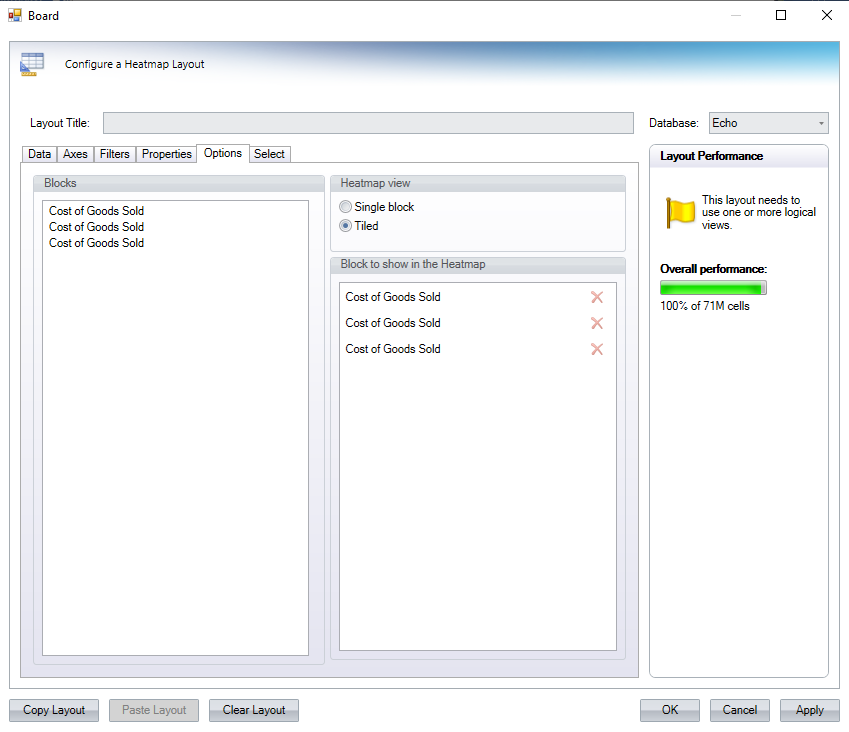
Heatmap Options
Blocks. Displays the Blocks added to the Layout. Drag and drop these Blocks to the "Block to show in the Heatmap" area.
Heatmap view. Choose how you want the chart to be displayed with the following options.
Single block. Multiple Blocks stacked, clustered or as different types: enable this option to view all Blocks at once on a single Chart.
Tiled. Enable this option to view each Block in the Layout.
Block to show in the Heatmap. Displays the Blocks listed here. Remove Blocks by clicking the red X, and add Blocks by dragging them from the Blocks section and dragging them to this area.
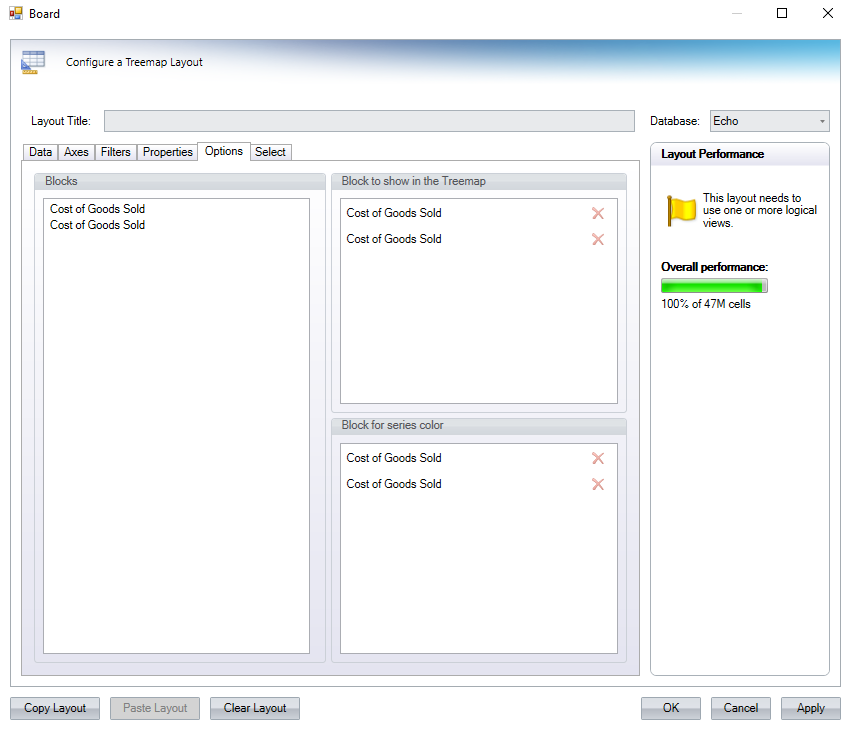
Treemap Options
Blocks. Displays the Blocks added to the Layout. Drag and drop these Blocks to the "Block to show in the Treemap" and "Block for series color" areas.
Block to show in the Treemap. Displays the Blocks listed here. Remove Blocks by clicking the red X, and add Blocks by dragging them from the Blocks section and dragging them to this area.
Block for series color. Displays different intensity of color to the Treemap tiles to represent the difference in value according to the Blocks added here.