This topic describes how to navigate and customize the settings and options of a Treemap chart Object, which are the following:
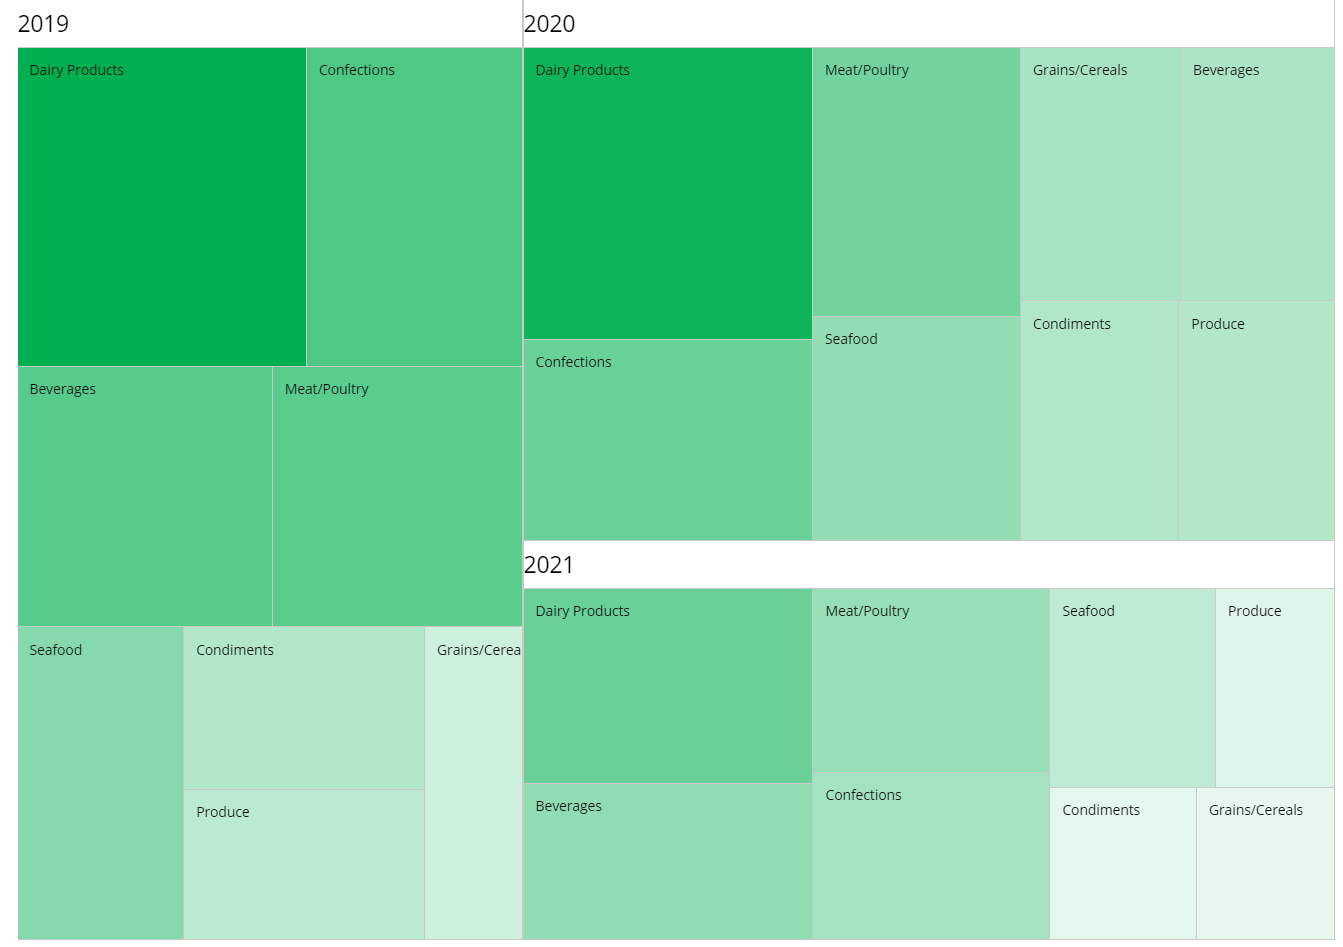
The Treemap chart is a diagram that shows data as a set of nested rectangles of different sizes and different shades of a color. A Treemap can be really useful in reports showing rankings, classification, item evaluations, and adoption across all business departments, even those less dependent on values or figures.
For example, you can use a Treemap to compare sales from various salesmen. A salesman with a large sales amount would be displayed as a large rectangle, while another salesman with a small sales amount would be displayed as a small rectangle.
In general, the Treemap is useful when you want to display a positive value (the area of rectangles) and a second quantitative value (the color of rectangles).
The Treemap is scaled to best fit the available space, so rectangle size should be considered in relation to each other, rather than as an absolute number.
Treemap chart: Layout properties
The Layout editor for a Treemap chart includes a specific menu for configuring which Block will be plotted in the chart and which Block values will affect the intensity of the color.
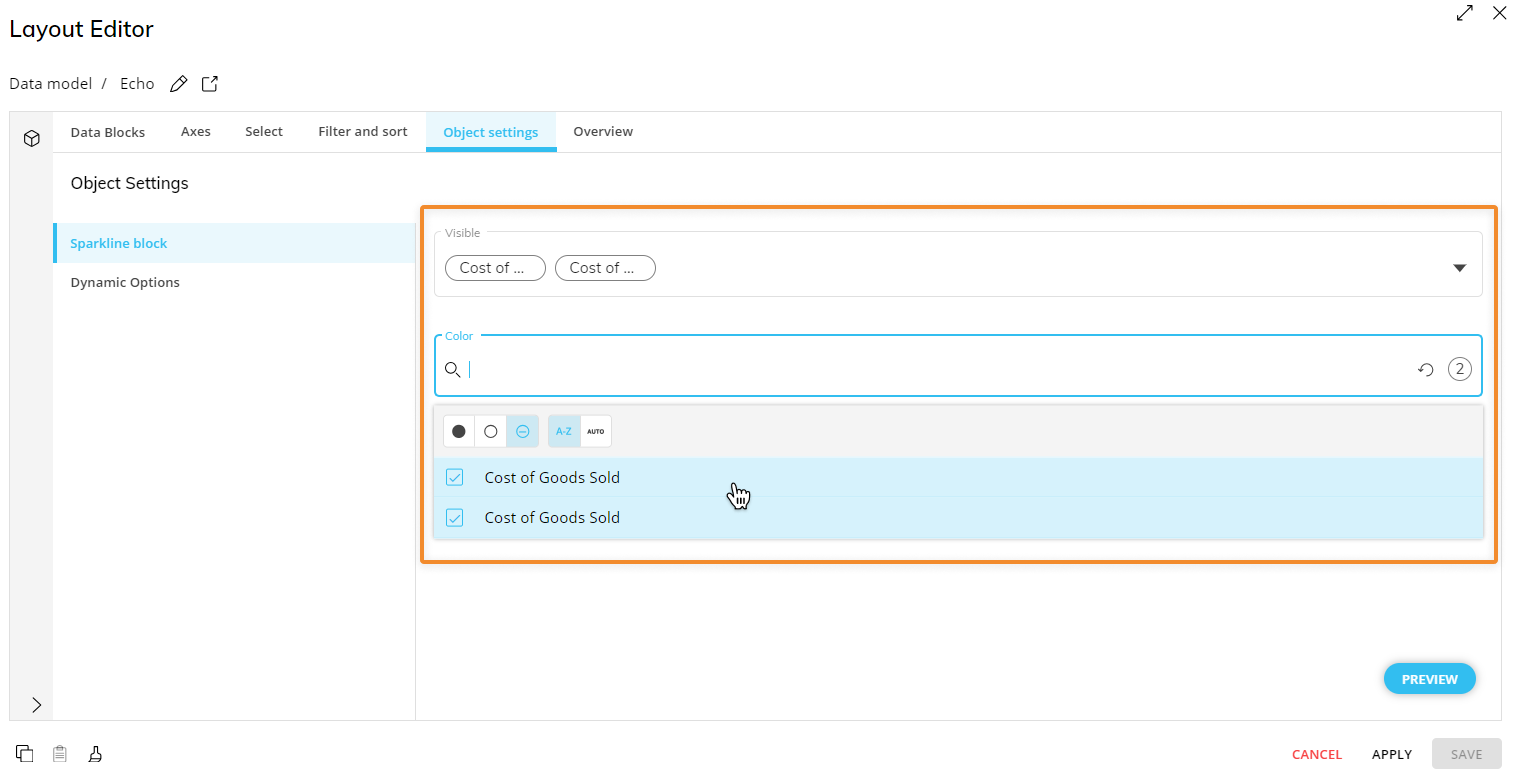
In Object settings and under the Sparkline Block menu, click on the "Visible" dropdown menu to select the desired Data Blocks you'd like to show, and click on the "Color" dropdown menu to select the Blocks you'd like to display different intensity of color to represent the difference in value.
Treemap chart properties
Additional Treemap chart properties are available from the Object Properties panel to the right of the Screen editing page once the Chart Object is selected and associated with a Layout. The Treemap-specific properties are highlighted in the following image:
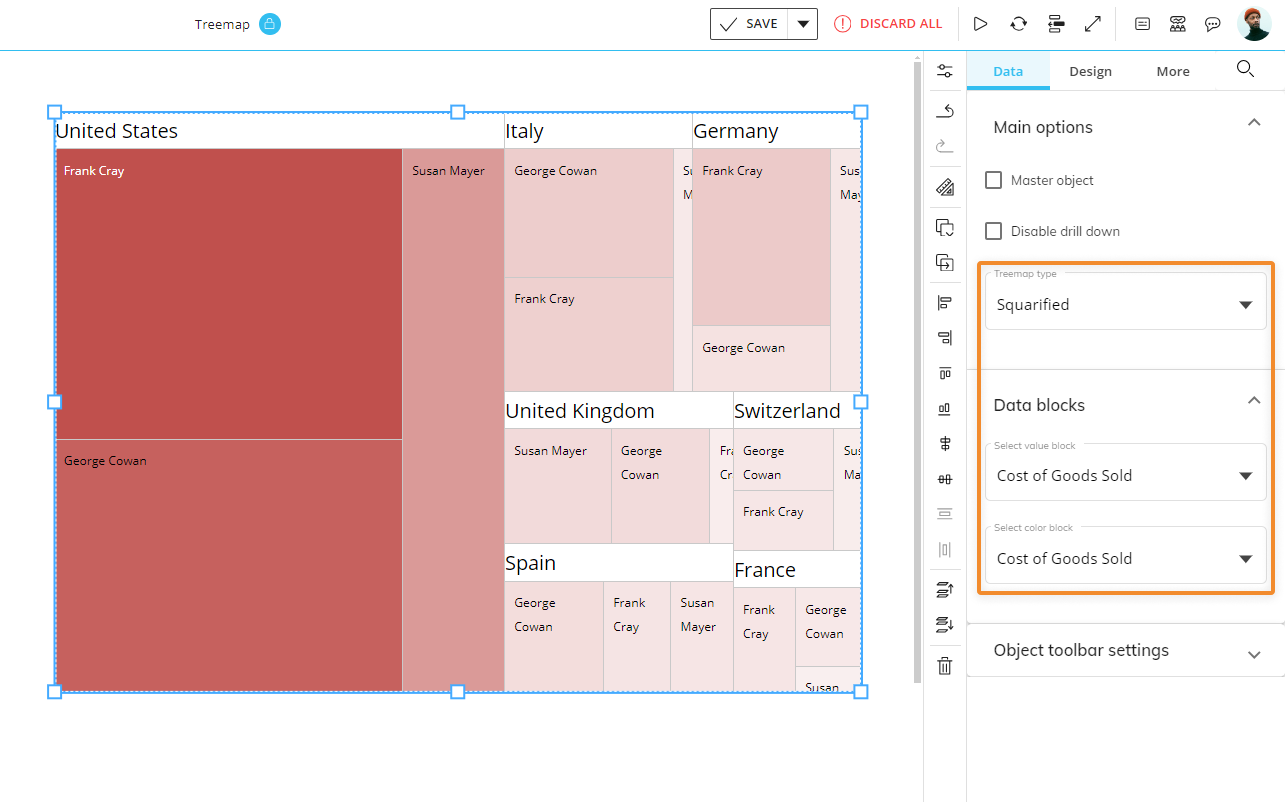
Under the Treemap type menu, the following options are available:
Squarified. Arranges rectangles in a hierarchical order, with those representing a larger value (with a wider area) positioned in the upper left corner. In case of Entity grouping, the hierarchical arrangement is iterated for each member of the least-nested Entity set By Row.
Vertical. Arranges rectangles vertically, with those representing a larger value (with a wider area) positioned at the top. In case of Entity grouping, the hierarchical arrangement is iterated for each member of the least-nested Entity set By Row.
Horizontal. Arranges rectangles horizontally, with those representing a larger value (with a wider area) positioned to the left. In case of Entity grouping, the hierarchical arrangement is iterated for each member of the least-nested Entity set By Row.
Under the Data Blocks menu, you can select which Blocks will be used as a driver for the rectangles color and area.
To configure the rectangles color, you can set a color alert on the Block set in the "Selected color block" drop down under the Data Blocks menu, otherwise the default color palette will be used. You can also configure the main color that will be used for all rectangles from the Color menu in the Screen editing page.