Analytical functions are essential tools in data analysis that enable complex calculations and insights from large data sets. They allow for real-time statistical measures, enhancing decision-making by tailoring calculations to user needs and facilitating dynamic reporting that identifies trends and anomalies.
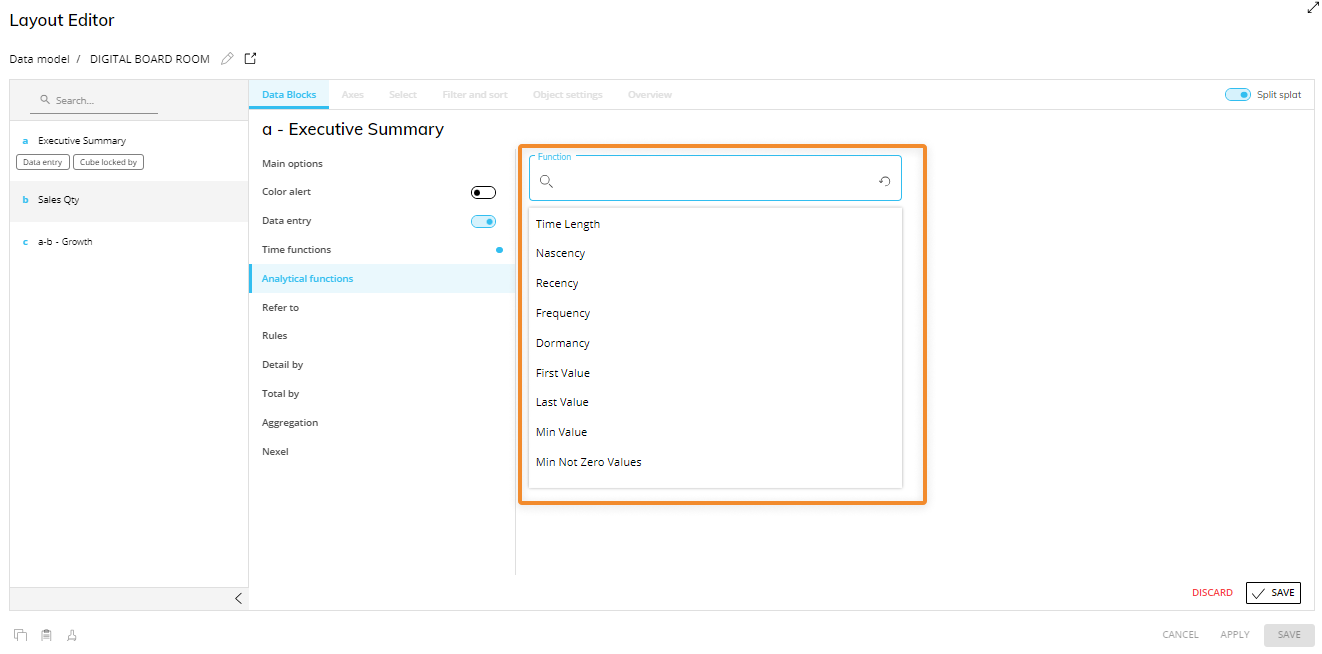
Under the "Analytical functions" menu, you can apply any function to a Cube in order to get useful common mathematical results on the fly.
These functions are grouped into three different categories:
Analytical Functions
Time Series
Statistical Functions
Analytical Functions work across Time Entities only. This means, for example, that if you use the Maximum function in a Data View, it will return the value of the period with the maximum amount. You cannot use this function to determine the maximum across various products.
The Time functions under the Time Series group will return a series of values as output, so they must be used in a Layout with at least one Time Entity By Row or Column. The other functions return a single value, so they do not need a Time Entity in the axes. If you use them with any Time Entity, the function will calculate values "until the period in row/column".
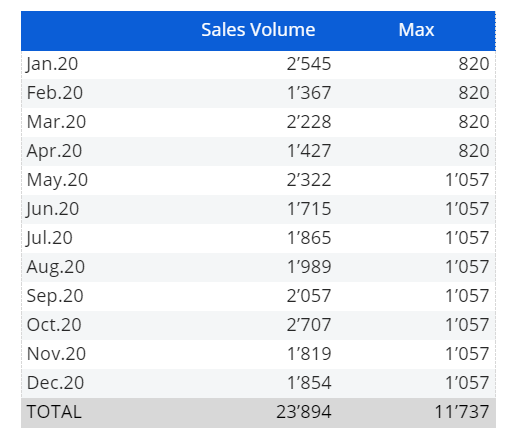
On every row, we have the maximum value of the series until that moment, removing the Entity "Month" from the axis will only render the overall maximum.
When using those functions in Dataflows, the row logic is ignored and you will always receive the overall maximum.
Analytical Function options
The analytical functions available in this menu are the following:
Analytical Functions
Time Length. Returns the amount of periods on which the time series is defined.
Nascency. Returns the amount of periods passed since the first non-zero value of the series.
Recency. Returns the amount of periods passed since the last non-zero value of the series.
Frequency. Returns the amount of non-zero-valued periods in the series.
Dormancy. Returns the amount of zero-valued periods in the series.
First Value. Returns the first value of the series.
Last Value. Returns the last value of the series.
Min Value. Returns the minimum value of the series.
Min Not Zero Value. Returns the minimum value of the series which is different from 0.
Max Value. Returns the maximum value of the series.
Total. Returns the Total value of the series.
Average. Returns the average value of the series (Total/Time Length).
Average Not Zero Values. Returns the average of the values that are different from 0 (Total/Frequency).
Median. Returns the median value of the series (mid-point of the sequence).
Median Not Zero Values. Returns the median value of the series excluding 0 values.
Time Series Functions
IdsiARX Naive. Given the value of the time series, it returns the Naive predictor (previous year) for that series.
Holt Winters. Returns the forecast on future values according to triple exponential smoothing model, the three parameters (alpha=0.05, beta=0.2, gamma=0.8) are not configurable, but you can select which time series to evaluate and the time range.
Linear Regression. Returns the values of the straight line that best fits the time series in terms of minimum squared error.
Statistical Functions
Next Value [IdsiARX Naive]. Returns the next value (first forecasted value) of the series according to the naive predictor (previous year).
Next Value [Linear Regression]. Returns the next value (first forecasted value) of the series according to linear regression mode.
Growth %. Returns the growth of the time series in percentage (this period value - previous period value)*100/ (previous period value).
Volatility. Returns the standard deviation of the return series.
Standard Deviation. Returns the standard deviation of the series (squared root of the variance).
R Squared. Returns the r squared of the series, defined as the ratio between the squared error of the regression model (residual variance) divided by the squared error of the average (total deviance).
Function settings
For every function that you can pick from the "Function" dropdown menu, you have the following function settings:
Time Entity. This dropdown menu allows you to decide at which level your period is defined. If you choose the Max Value function, for example, and you choose Day as the Time Entity, the function will return the amount of the day that contained the maximum value. Otherwise, if you select Month as the Time Entity, it will return the value of the month with the maximum value. With the "Auto" setting, the system will use the Time Entity in the Cube Structure or, if you have a Time Entity set in one of the axes, it will take it from those fields.
From/To. These two dropdown menus allow you to consider only a part of the time series, deciding which periods the function will consider to calculate the output.
The "Ignore last period" checkbox is only used for the functions IdsiARX Forecast, Linear Regression, and Multiple Linear Regression, and allows you to ignore the last period in your forecast.
For more details on the statistical functions and predictive analytics, please read the BEAM section of this manual.