Pivoting a Table in the Board M365 Excel Add-in allows users to define how fields defined in a Dataset or a Layout are arranged within the Table by assigning them to the Values, Rows, or Columns areas. This option enables users to reorganize and analyze data dynamically directly in Excel.
Users can drag and drop fields or select them using the corresponding checkboxes to modify the Table structure, group data across multiple dimensions, and display numeric fields as measures with configurable aggregation options.
To drag and drop a field, select the
.png) icon and move the field to the desired area.
icon and move the field to the desired area.To move a field using checkboxes, select the checkbox for the field. The field is automatically added to its corresponding area.
The following limitations apply:
Each Dataset field can be added only once to the pivot configuration. The same field cannot be added multiple times to Rows, Columns, or Values.
Grand total rows and grand total columns are not supported.
How to pivot a Table
To pivot a Table:
Click on a cell within the Table you want to pivot or, after creating a Table, you will be prompted to pivot the Table automatically.
The Task pane opens automatically. If no Table cell is selected, the options in the panel are not displayed.
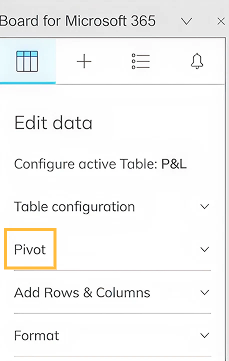
From here, you can:
Select Pivot to open the pivoting pane.
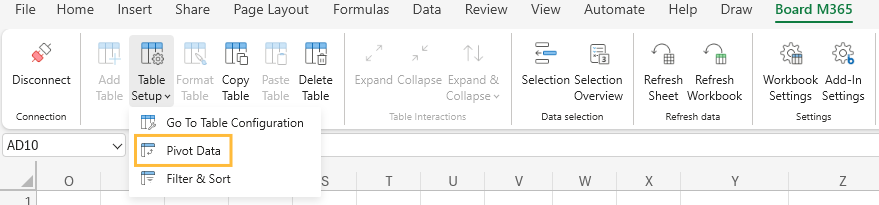
Select a cell in the Table, then select Table Setup in the Board ribbon, and click Pivot Data.
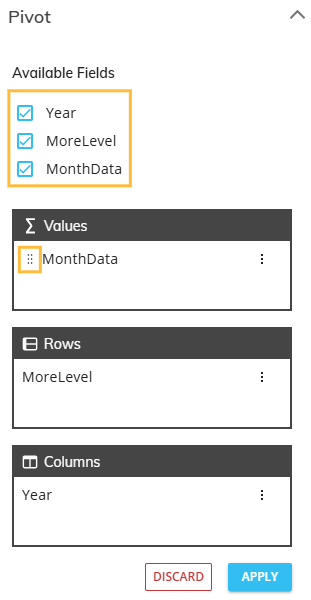
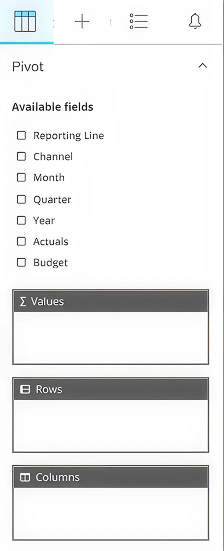
The pivoting pane displays the Fields area, which lists all available fields that can be assigned to the Rows, Columns, and Values areas.
Drag a field to the desired area or select its checkbox to define the Table structure.
Automatic field placement
When a field is selected, it is automatically placed based on its type:
Non-numeric fields and standard Entities are placed in Rows.
Time Entities are placed in Columns.
Numeric fields are placed in Values.
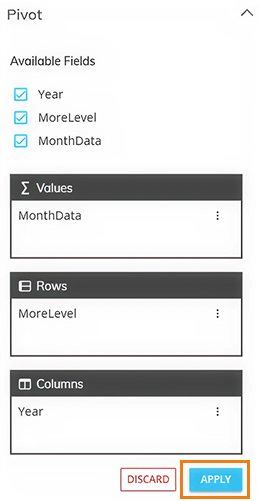
When the Table pivot configuration is completed, click “APPLY” to confirm the changes.
Fields area
The Fields area lists all fields available in the selected Dataset or Layout and is used to configure the Table structure.
The following rules apply:
Each Dataset field can be assigned to only one area: Rows, Columns, or Values.
A field cannot be added more than once to the pivot configuration.
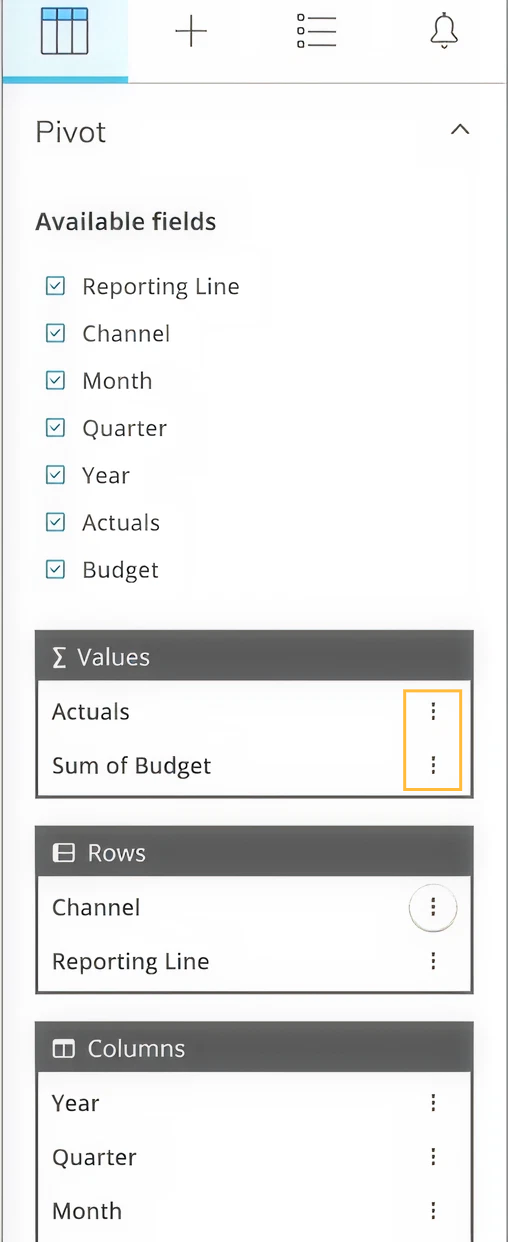
Fields options menus
To access a field’s options menu, click on the three-dot icon![]() on the right side of the field.
on the right side of the field.
Values area
The Values area defines which numeric or calculated fields are displayed as measures in the Table. Each field added to this area appears as a separate column, using the field name as the column header (for example, Sum of Actuals).
Reorder Value fields or move them to another area by dragging and dropping them or by selecting their checkboxes.
To configure a Value field, click on the three-dot icon next to the field name. The options menu that opens allows the user to:
Rename header. Customizes the displayed header name.
Set subtotal aggregation. Defines how values are calculated.
The available aggregation options are:
Sum
Min
Max
Count
Average
First
Last
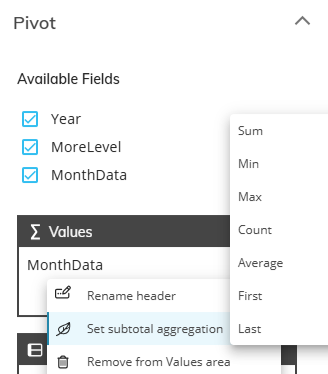
Remove from Values area. Removes the field from the Values area.
Rows area
The Rows area defines how data is grouped vertically in the Table when two or more fields are added. Each field added to this area creates a Row Group and determines the hierarchical structure displayed on the left side of the Table.
Multiple Row Groups are supported and are displayed according to their order. The order of the fields defines the grouping sequence and hierarchical nesting, following the same hierarchy logic as a Flex Grid.
Reorder Row fields or move them to another area by dragging and dropping them or by selecting their checkboxes.
To configure a Row field, click on the three-dot icon next to the field name. The options menu that opens allows the user to:
Rename header
Expand/Collapse. When the Table contains hierarchical data, users can expand or collapse levels to navigate the data structure. Hierarchies are defined either by an unbalanced hierarchy or by a group of fields arranged in the Rows area. Depending on the hierarchy type, the following options may be available:
Expand. Displays the next level of detail.
Collapse. Hides the expanded level.
Expand one level. Expands the hierarchy by one level only.
Collapse one level. Collapses the hierarchy by one level only.
The “Expand one level” and “Collapse one level” options are available only for unbalanced hierarchies.
By default, all Row Groups are displayed as collapsed when a new Table is created. If new group elements are introduced due to a selection change or a data refresh, they are also displayed as collapsed.
.png)
Remove from Rows area. Removes the field from the pivot configuration.
Columns area
The Columns area defines how data is grouped horizontally in the Table when two or more fields are added. Each field added to this area creates a Column Group and determines the hierarchical structure displayed across the top of the Table.
Multiple Column Groups are supported and displayed according to their order. The order of the fields defines the grouping sequence and hierarchical nesting, following the same hierarchy logic as a Flex Grid.
Reorder Column fields or move them to another area by dragging and dropping them or by selecting their checkboxes.
To configure a Column field, click on the three-dot icon next to the field name. The options menu allows the user to:
Rename header
Expand/Collapse. When the field represents a hierarchy that supports these interactions, the user can expand or collapse its levels to navigate the data structure. Depending on the hierarchy type, the following options may be available:
Expand. Displays the next level of detail.
By default, all Column Groups are displayed as expanded.
Collapse. Hides the expanded level.
Remove from Columns area. Removes the field from the pivot configuration.
.png)
You can add more than one Row or Column Group to a Pivot Table. The Table shows the result with the same structure as a Flex Grid.
Expand and Collapse
Expand and Collapse actions allow the user to navigate hierarchical data in fields placed in the Rows or Columns areas.
These actions can be performed from:
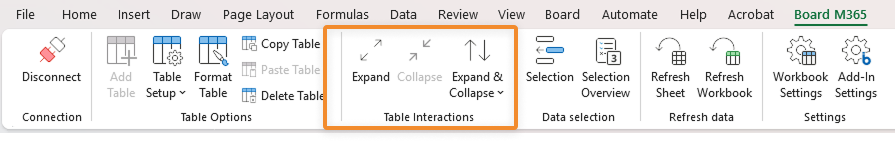
The ribbon menu. In Table Interactions group, you have three commands:
Expand
Collapse
Expand & Collapse. Click to open a submenu with the following options:
Expand all
Collapse all
Expand entire field
Collapse entire field
To use the Expand and Collapse actions from the ribbon, first select a header cell in the Table. If a header is not selected, these options are not available.
When supported, the user can use “Expand All” or “Collapse All”.
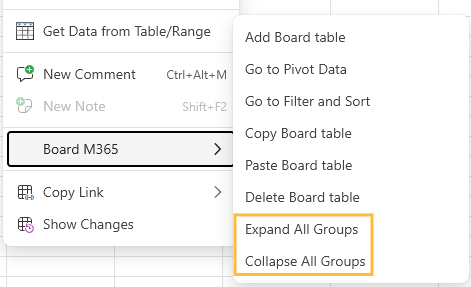
The Task pane. Click on the three vertical dots to open the menu shown below.
When selecting multiple elements as a cell range, Expand and Collapse actions are not available. Expand and Collapse one element or all.
The expand and collapse state is saved with the workbook and preserved after data refresh. Any changes to selections, Entity members, or relationships are reflected automatically, and the Table maintains the configured expand or collapse behavior.
You can expand and collapse Row and Column Groups from the Ribbon or right click menu. The expand and collapse status is saved with the Excel workbook and is kept after refresh or reconnection.
Changing an Entity member code or description resets expanded or collapsed state in Excel upon refresh.
Known Limitations
Algorithms cannot reference aggregations calculated in the Layout. For example: min, max, sum, and average cannot be used if they are calculated in the Board Platform instead of the Board Engine.
Algorithms can reference only Data Blocks that are included in the Layout. Algorithms cannot reference Entities By Row or other algorithms that are not part of the Data Blocks in the Layout.
It is not possible to refresh only one calculated field. When refreshing, the Board Engine recalculates the entire Layout to ensure that all results remain consistent.
Images cannot be used as Algorithm Data Blocks.
Dates remain stored as date values rather than text. As a result, date values support arithmetic operations (for example, +2 adds two days) and comparisons.