To create a Table, you can choose to use the Layout Editor, which mimics the one in the Board Platform.
Layout creation can be restricted for certain end users depending on their application profile settings made in the Features section and in the Workbook settings.
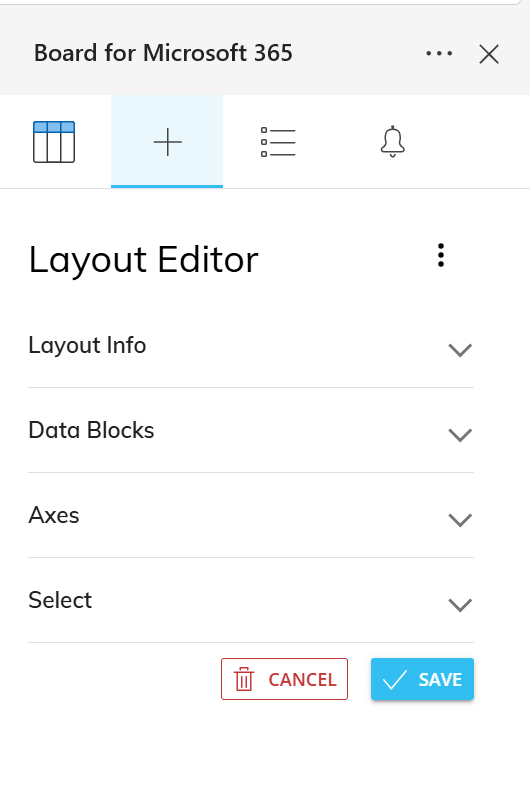
Add-in Layout Editor
Similar to a Flex Grid Object, users can create Tables via the Layout Editor in the right task panel. The Add-in Layout offers many of the same configurations, although some limitation apply. You can add Cubes, Algorithms, and Entities.
You must configure the Layout with at least one Data Block, and you must dimension the Layout with at least one Entity.
The first Data Block of a Layout must be a Cube or an Algorithm.
Data Blocks
The Data Blocks section in a Table Layout is where you add a Block of data using the + button. Choose to add a Cube, Entity, or Algorithm and click "SAVE". Then configure the appropriate settings. To see additional Block settings, click the downward arrow.
The following web platform Layout options are not available in the Add-in Layout Editor:
Color alert
Data entry
Analytical functions
Detail by
Total by
Aggregation
Nexel
Row totals
Hide zeros
Block settings in M365 Excel Add-in Layouts differ from Layouts in the web platform. Read the paragraphs below to find out which Block settings are available.
How to delete or move a Block
To delete Blocks, hover over the Block and a trash icon will appear to click.
To move Blocks, drag and drop them while clicking on the move icon.
The type of Data Blocks and their settings you can configure in the Add-in Layout Editor are the following:
Cube
Choose the Cube from the dropdown and click SAVE. Click on the downward arrow to reveal the following Block settings:
Main options. Main options for a Cube are different than in the platform.
Cube. Choose the Cube you want to use. Only available when adding a Cube Data Block.
Heading. Name the Data Block.
Digits. As in the web platform, sets the number of decimal digits to display.
This option only applies to numeric values.
Hide Block.
Substitution formulas cannot be used in the Block heading of a Table
Aggregation function. As in the web platform, defines the aggregation function for hidden blocks.
Time Functions. As in the web platform, you can add a function, enable the Previous year checkbox, add a period offset and cycle configuration, or select a Calendar Time Entity.
Refer to. As in the web platform, set a "Refer to" rule.
To find out more about these settings in depth, read about Data Block settings.
Algorithm
When you add an algorithm, click on the downward arrow to reveal the following Block settings:
Main options
Algorithm. As in the web platform, type in your desired algorithm.
Heading. Name the Algorithm.
Algorithm type. Choose between Numeric (default), Text, Date, or Picture.
Summary. As in the web platform, defines the method for calculating row and column totals.
Digits. As in the web platform, sets the number of decimal digits to display.
This option only applies to numeric values.
Hide Block.
Time Functions. As in the web platform, you can add a function, enable the Previous year checkbox, add a period offset and cycle configuration, or select a Calendar Time Entity.
Refer to. As in the web platform, set a "Refer to" rule.
Rules. As in the web platform, add a Rule.
To find out more about these settings in depth, read about Data Block settings.
Entity
Choose the Entity from the dropdown menu. Click on the downward arrow to reveal the following Block settings:
Main options.
Display mode.
Summary. As in the web platform, defines the method for calculating row and column totals.
Heading. Name the Rule.
Digits. As in the web platform, sets the number of decimal digits to display.
This option only applies to numeric values.
Hide Block.
Time functions. As in the web platform, you can add a function, enable the Previous year checkbox, add a period offset and cycle configuration, or select a Calendar Time Entity.
Refer to. As in the web platform, set a "Refer to" rule.
Rules. As in the web platform, add a Rule.
To find out more about these settings in depth, read about Data Block settings.
Axes
In the Axes area, you can add multiple Entities to the "By Row" area. In fact, you can add much more Entities by Row than in a Data View in order to display complex grids of data in different ways with the powerful Pivot Mode tool.
Unlike a Data View, rows and columns are not configured within the Layout but rather within the Flex Grid Object. Entities are only set "By Row" in the Layout and configured in more detail directly from the Flex Grid itself, for example dimensioning the grid using the Fields panel, grouping, and defining specific sorting and filtering from each Entity heading.
Underneath the "By Row" area, you can define the member display mode and enable or disable the "Extract zeroes" feature like with other Objects.
The functionality of Data Entry on Row Headers is not available.
For a Layout with multiple Unbalanced hierarchies, the Flex Grid execution bypasses one limitation of Unbalanced Entities: that only the most-nested Entity by row is executed in terms of aggregation while the others are only used to group rows. With the Flex Grid Object, the aggregation of multiple unbalanced Entities is executed regardless of this limitation.
For example, in a Data Model where the Entities Account and Reporting Unit are both unbalanced, a Flex Grid calculates the roll-up of Account (e.g. Total Revenues) and then further rolls-up these figures from each Reporting Unit into the parent Reporting Unit (e.g. Organizations, Sub-Regions, Regions, etc.)
Select
This tab allows you to add a Layout Selection solely on the Excel Table Object, similar to a Flex Grid. with a few differences outlined below. The Layout Select is configured exactly like the Select function, considers security selections, and follows the Selections application sequence (Select at runtime).
Read more about the Flex Grid Layout Select and Select behaviors.