This article covers:
General Platform Navigation
My Account: Select the waffle icon to access your My Account settings.
Account Info: View and manage your account information such as your personal information, settings, and access permissions.
Favorites: Your favorite and commonly used select indicators can be accessed here. Economist curated favorites cannot be removed, but user or company specific favorites can be added and removed.
Alerts
Receive real-time alerts on headwinds and tailwinds that affect your business, enabling you to respond quickly, seize opportunities, and mitigate risks. The Foresight Alert Service continuously monitors your data and triggers alerts when significant variances occur across indicators or models, ensuring rapid assessment and response to market shifts.
Indicators are monitored daily, with alerts generated based on user-defined thresholds. Detected variations, whether in individual or composite indicators, are paired with identified lead times, helping you anticipate and prepare for potential business impacts.
Insights
View dashboards that present key insights from econometric models in a format that is easy to interpret. Quickly identify areas of risk and opportunity, and drill down into details to better understand the economic drivers of your business.
Filter: Narrow your Insights by typing specific keywords related to your scenario.
Condense List: Switch to a simplified description of Insights for quick scanning. Deselect to return to a detailed view.
Open: Access Insights to visualize and analyze critical data metrics.
Sync Data To Report: Synchronize application data with the reporting warehouse.
Note: This feature may not be enabled for all customers. Contact your account administrator or Board Support to confirm availability.
Model Presentation
Model Presentation highlights key information about model performance and forecasts through clear visualizations and statistical analysis.
Model Forecast: Displays the selected scenario(s) for the chosen model:
Raw values: Line chart of actuals and forecasts.
Year-over-Year values: Bar chart of actuals and forecasts.
Optionally enable a fit line for forecasts and view Model Score and R² from the hamburger menu (☰).
Available only when an individual model is selected but can be compared across scenarios.
Model Performance: Foresight's genetic algorithm determines the model that best fits with actual historical data on which it is modeling.
Contribution: Shows how much each underlying indicator contributes to the forecast for a period. The total forecast equals the sum of these contributions. Contribution is not available for models with primary variables that do not use a log transformation.
Data History: Lets you adjust visible historical periods (12, 24, 36, or all). This is a visual change only and does not affect calculations.
Supports backtesting by allowing CSV exports of actuals and forecasts.
An As Of Date can be applied to review forecast performance at a specific point in history.
Waterfall: The waterfall chart highlights the cumulative effect of positive and negative values, showing how each element influences the overall forecast across the selected period.
Note: This feature may not be enabled for all customers. Contact your account administrator or Board Support to confirm availability.
Model Health Dashboard
View a dashboard that brings key insights from log-log locked models and provides a comprehensive view of the model’s forecast and performance.
Reports
Create custom reports using your forecast models to deliver insights tailored to your needs. Mix and match report components, view multiple models side by side, and drill down to understand how different model elements contribute to overall performance.
You can build reports from a blank template or generate them directly from analyses in Workbenches and results from Models. Use these reports to compare your Foresight forecasts with other internal plans, helping you pinpoint areas of opportunity and potential concern.
How to Create a Report
Select New Report. A New Report form appears.

Fill out the form.
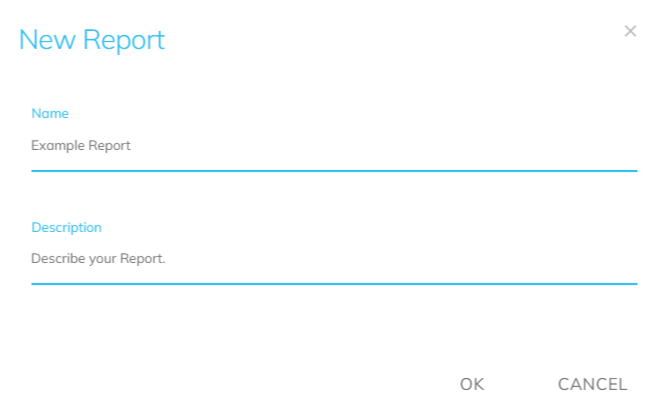
Select OK when finished. A blank Report template appears.
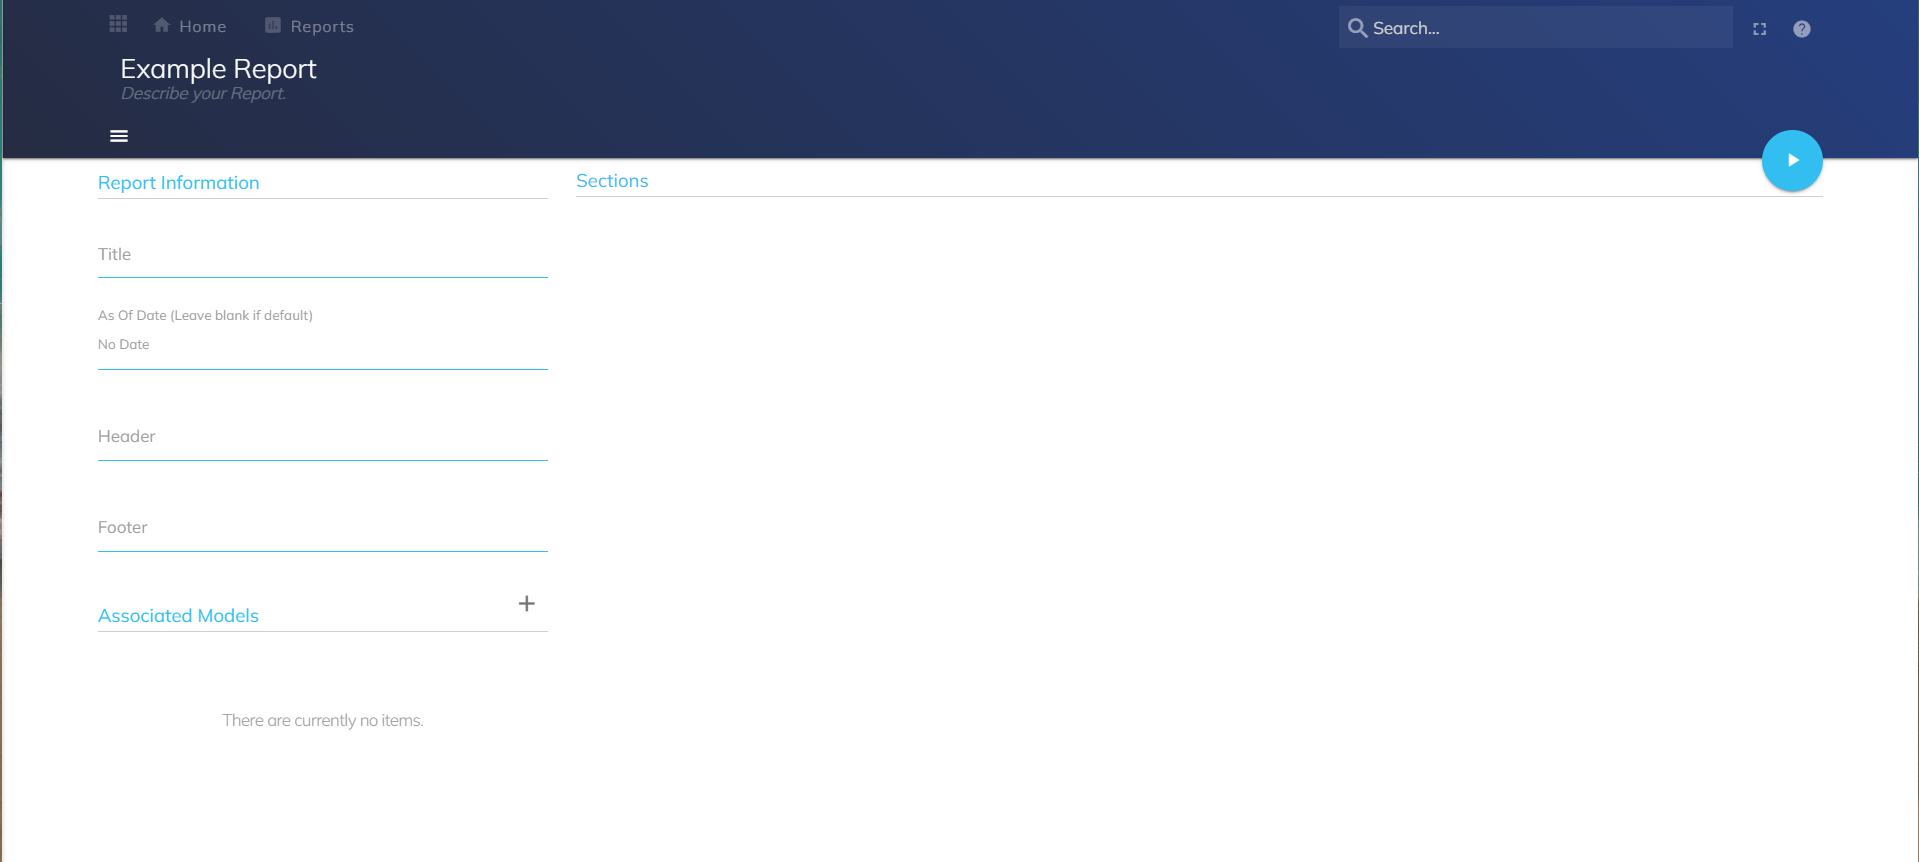
Reports Page
New Report: Create a new Report.
View My Reports: View the Reports you have access to. Select to view Reports you own. Deselect to view Reports you have access to.
Filter: Use keywords associated with specific Reports to reduce the time spent searching for your desired Report(s).Type in specific keywords to narrow your Report view.
Condense List: Select to view a simplified description of your Reports. Deselect to view a detailed description of your Reports.
Open: View your Report(s).
Edit: Manage your Report(s).
Copy: Copy your Report(s).
Export: Export your Report(s) to your device.
Delete: Delete your Report(s).