Workbenches allow you to collect, organize, and visualize large amounts of data. They enable you to compare relationships between a primary indicator and secondary indicators, helping you identify and describe compatible data series.
This article covers:
Create a New Workbench
From the Workbenches Page
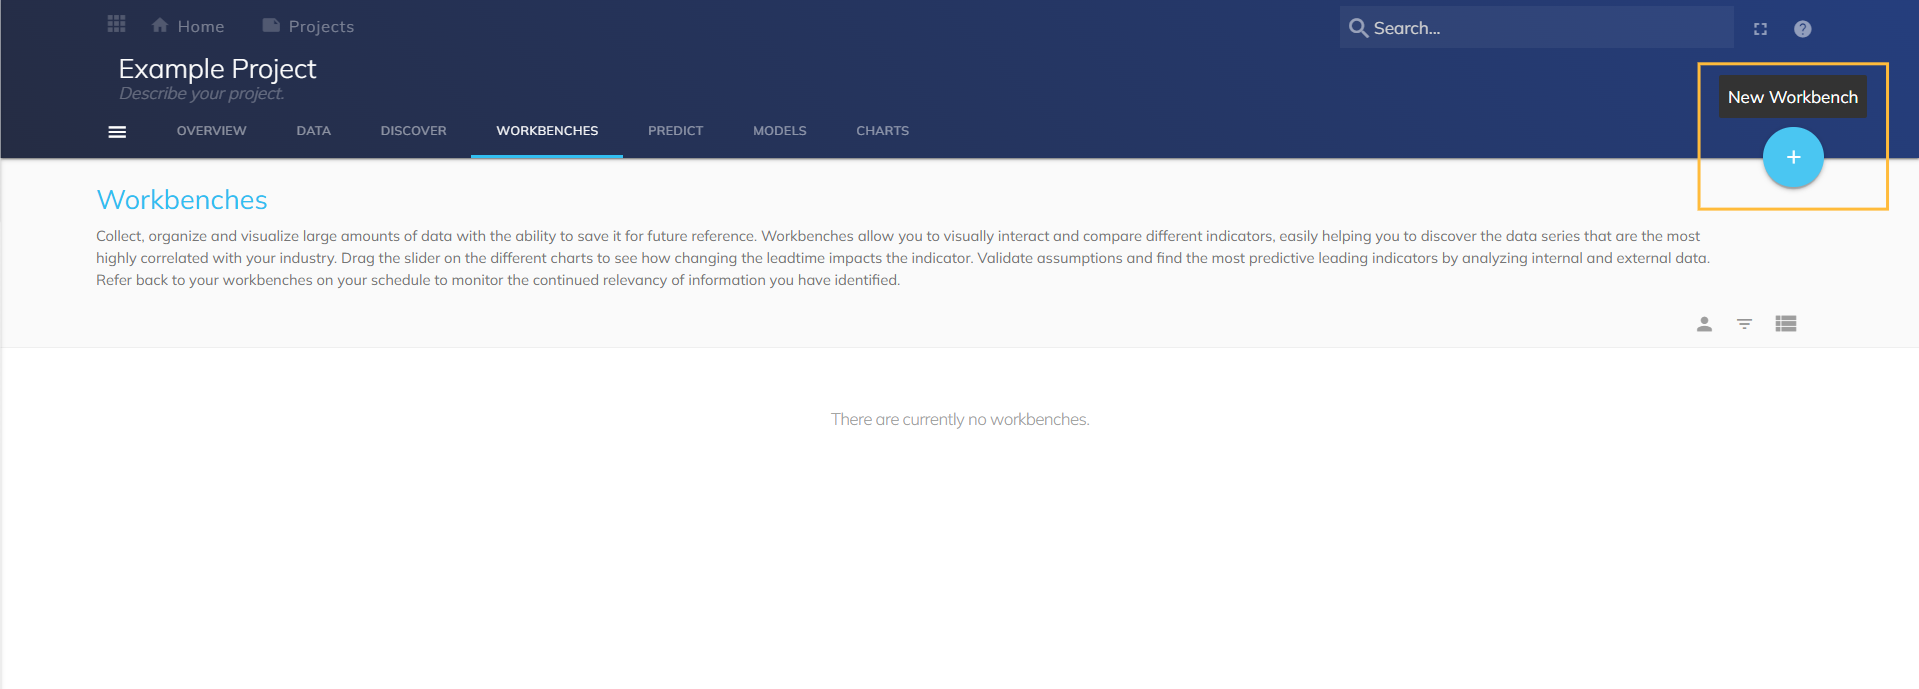
Navigate to the Workbenches page.
Select the plus icon (+) to create a new Workbench.
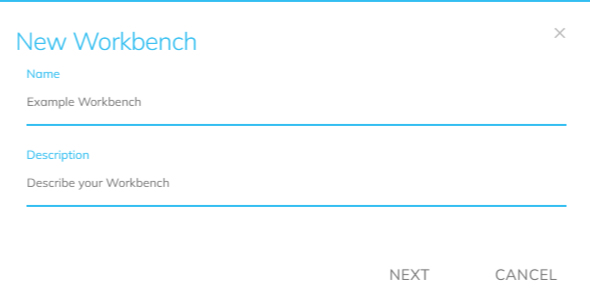
Fill out the Workbench form. Both Name and Description are required.
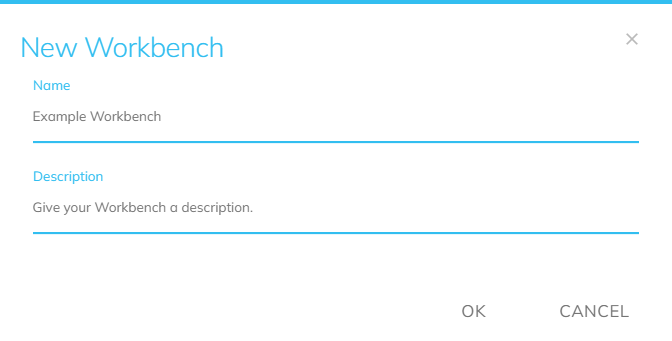
Select OK. The page refreshes to an empty Workbench.
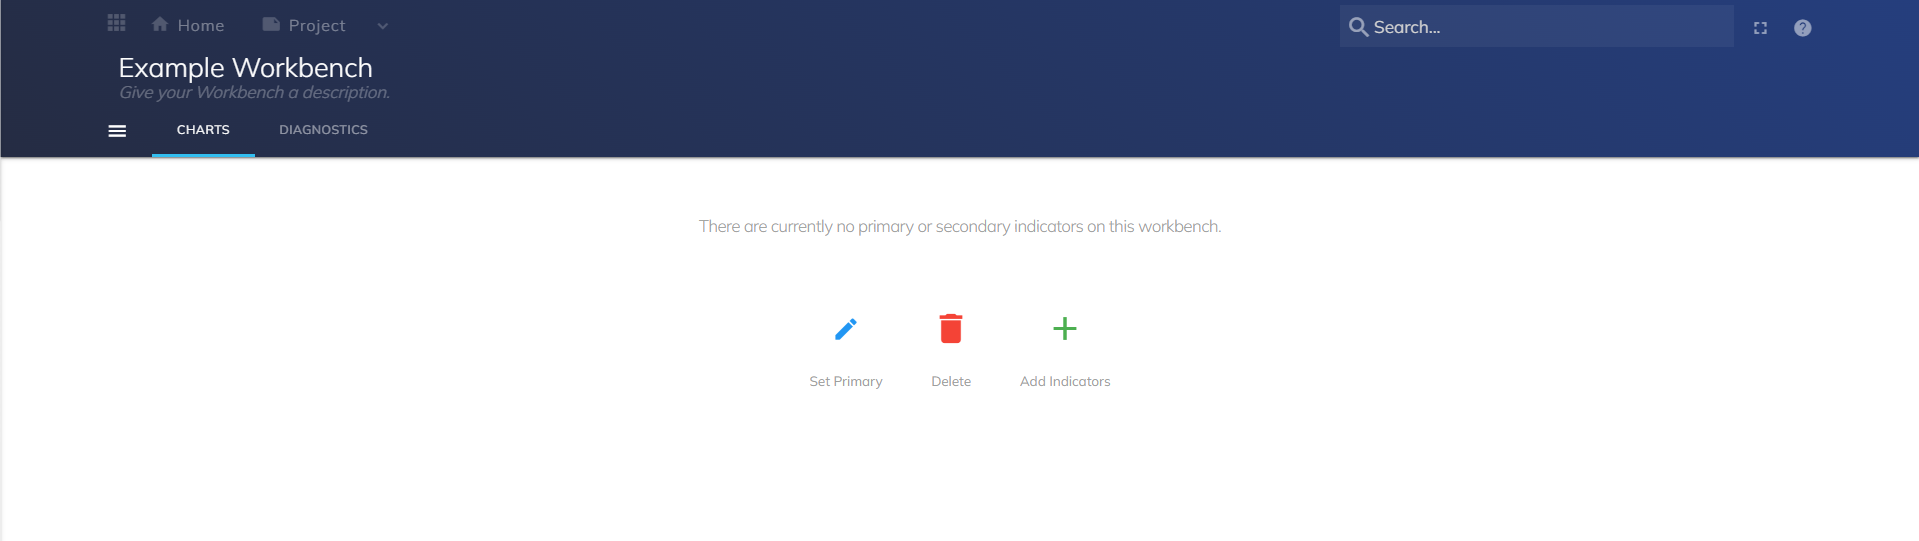
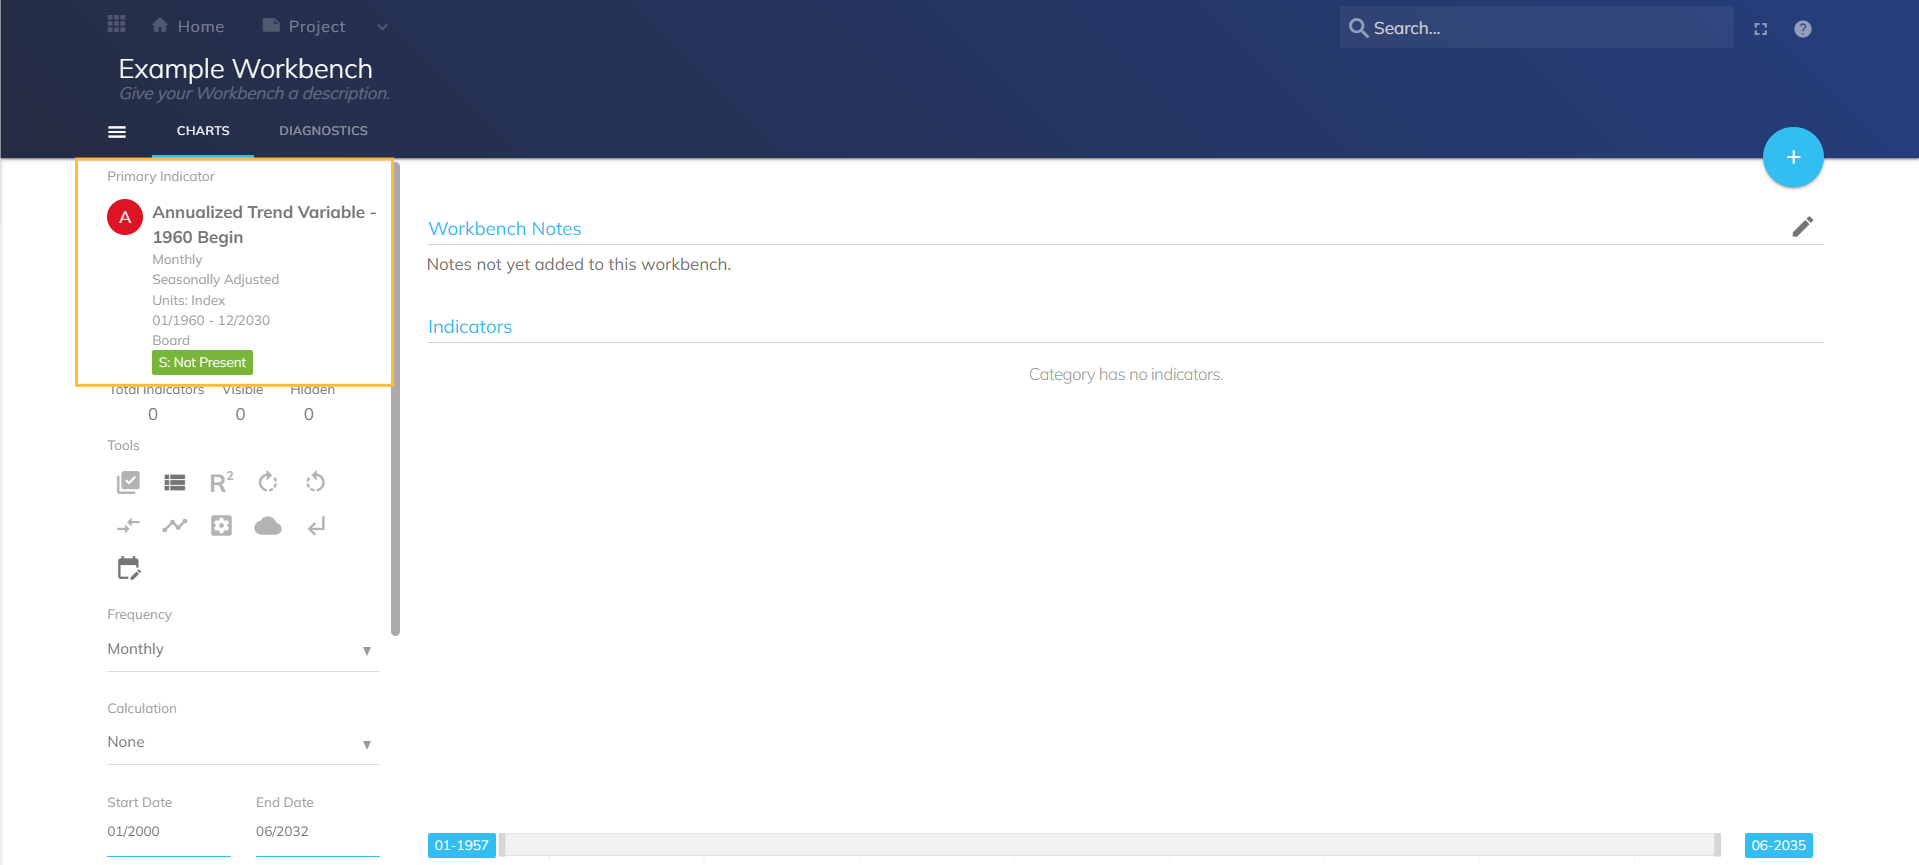
Adding a Primary Indicator
Select Set Primary. The Search modal opens. Use Search features to select an indicator (see Search Modal).
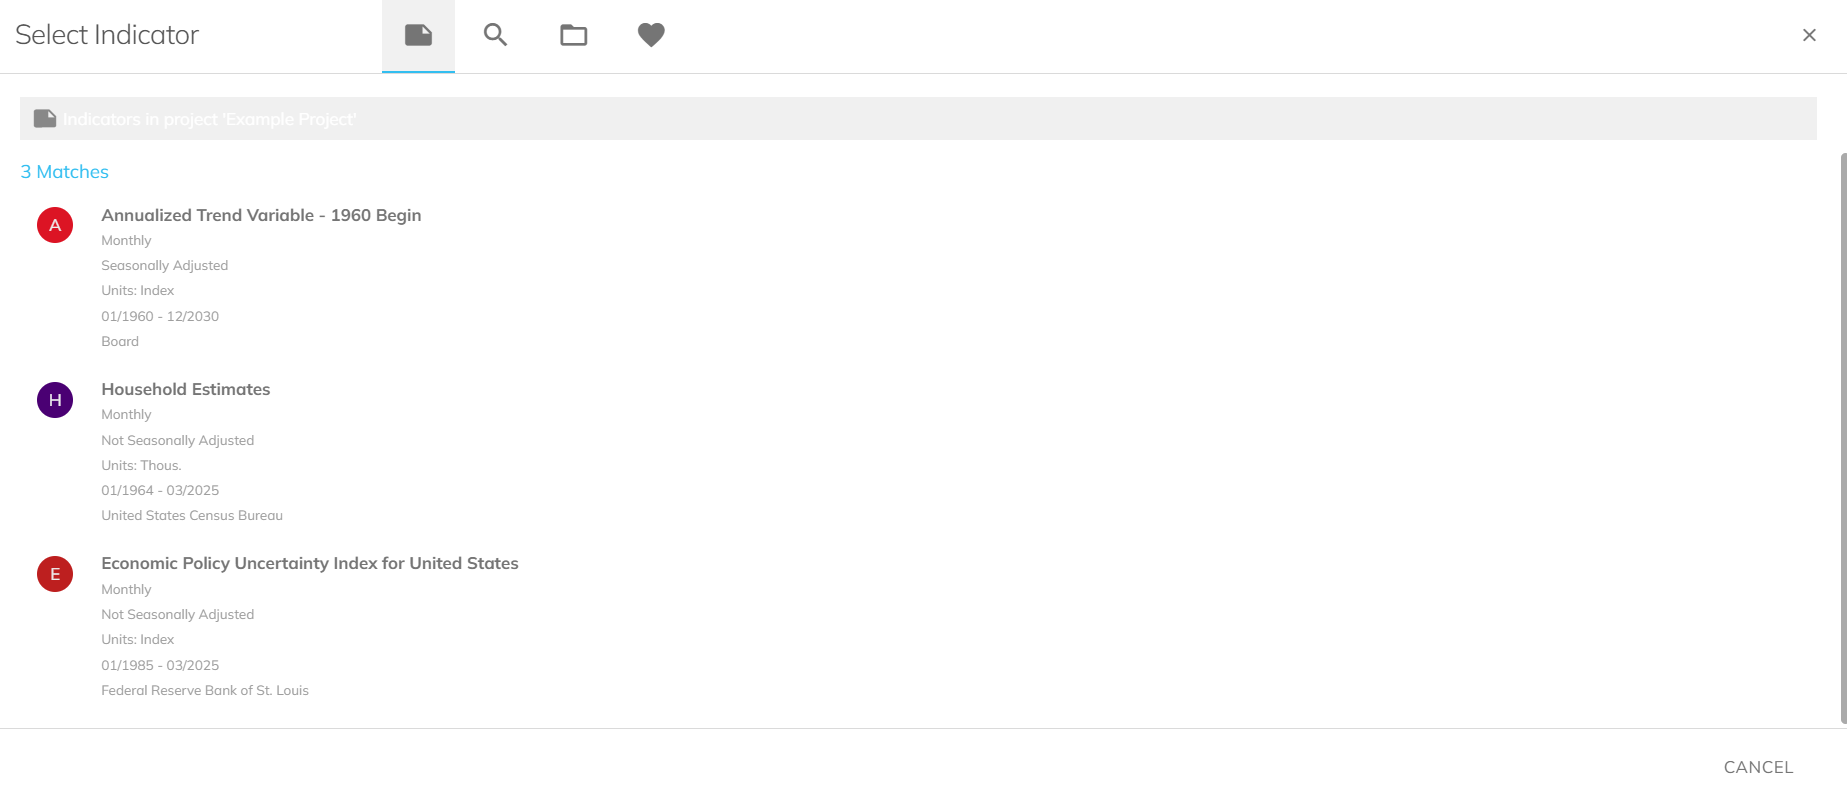
The selected primary indicator appears on the Workbench.
Adding Secondary Indicators
Select the plus icon (+) in the top-right corner. The Search modal opens. Use Search features to select an indicator (see Search Modal).
The selected secondary indicators are added to the Workbench.
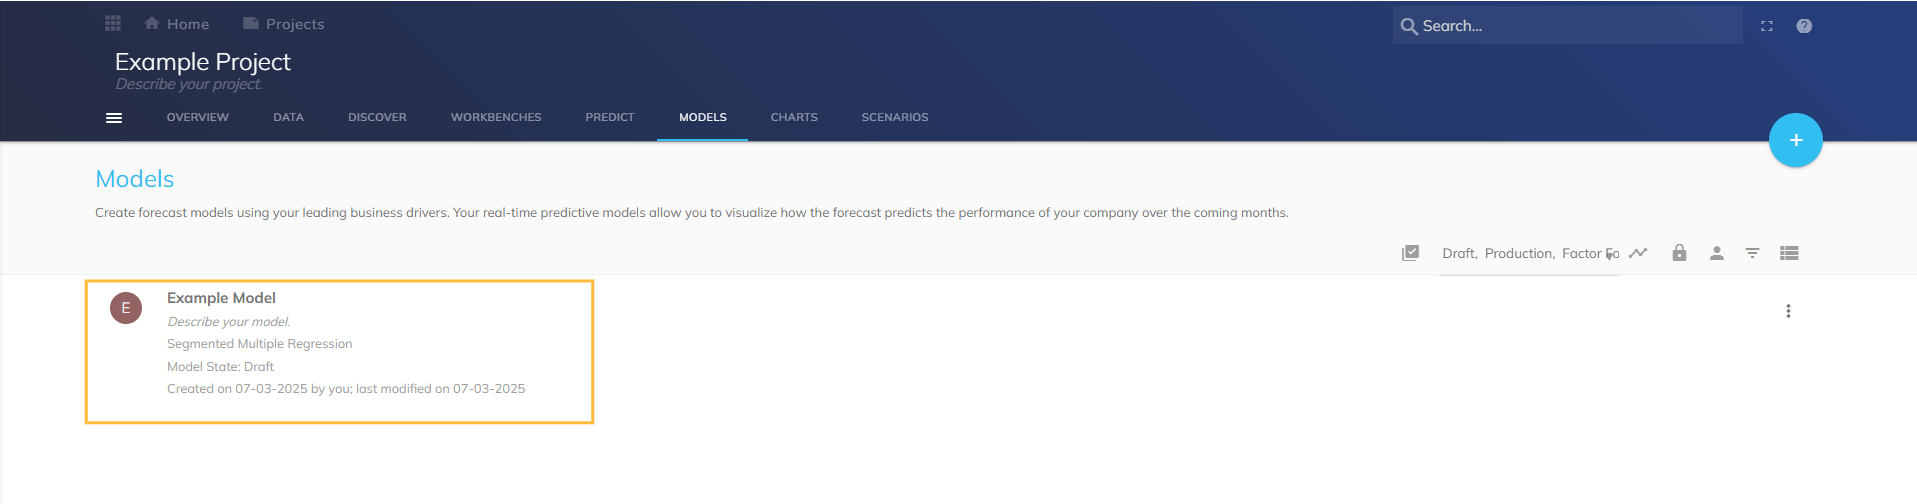
From a Model
Navigate to the Models page and select a model.
Select the hamburger menu (
.png) ). Select "Create Workbench".
). Select "Create Workbench". 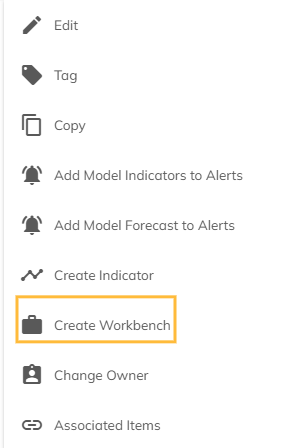
In the New Workbench modal, enter a Name and Description, then select NEXT.
A confirmation screen appears. Select OK.
.png)
The new Workbench opens.
.png)
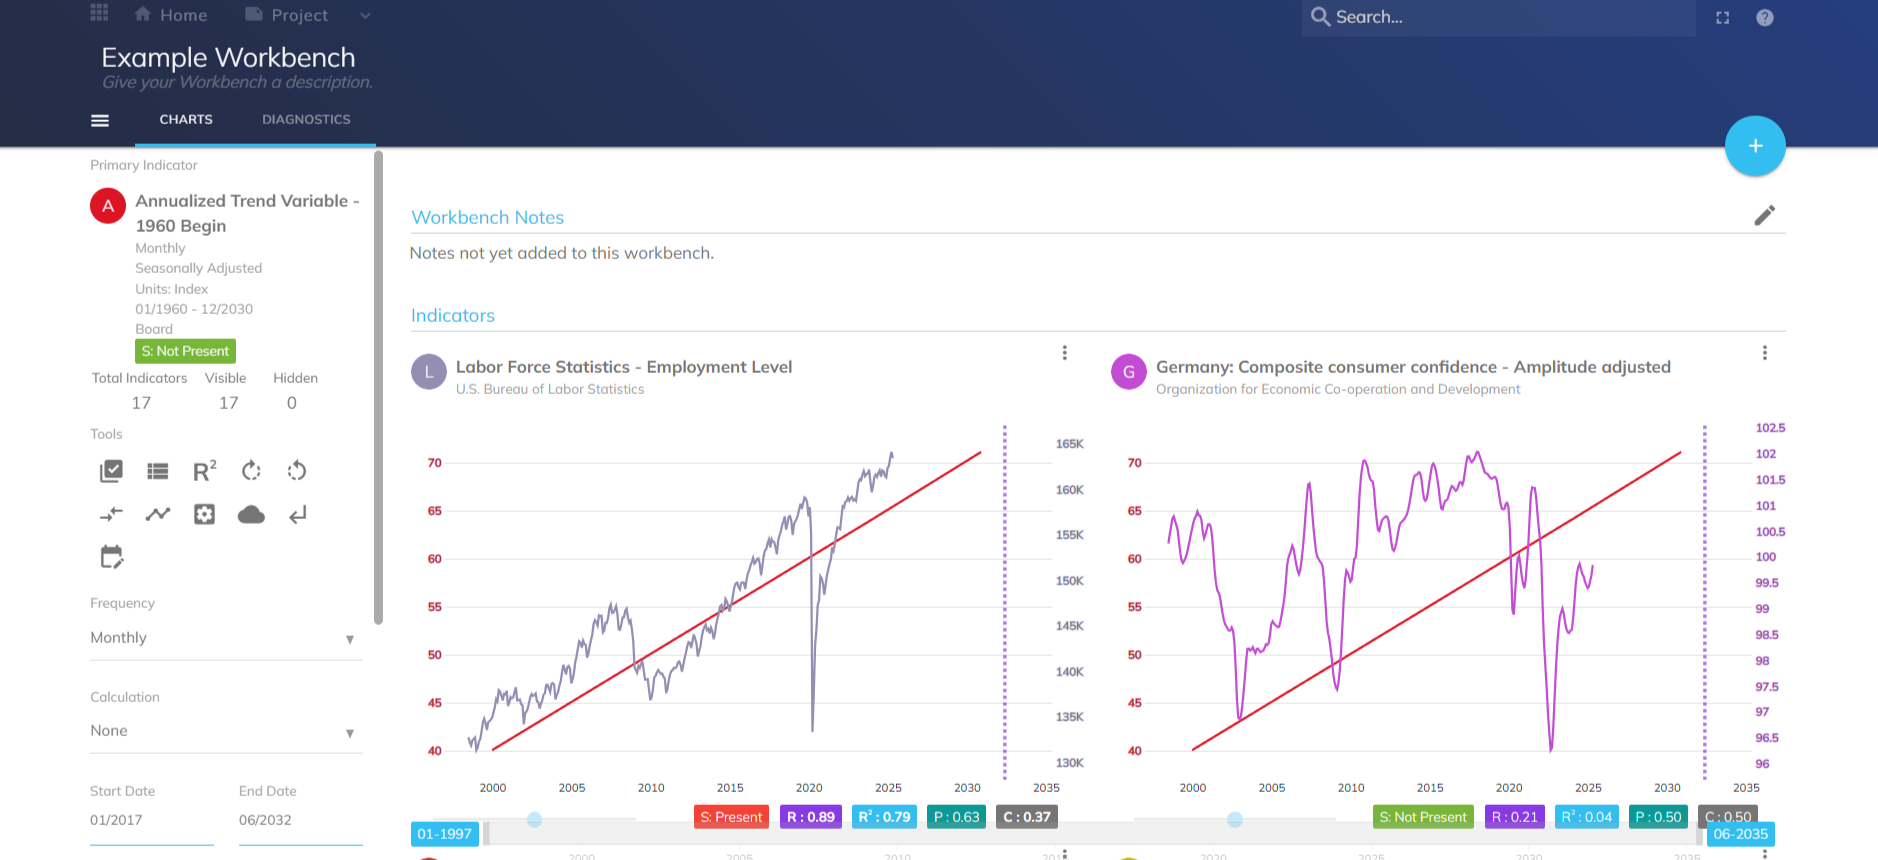
Chart Features
The left axis represents the primary indicator, with color derived from metadata.
The right axis represents secondary indicator, with colors also derived from metadata.
Charts use dual axes to align units and highlight trends.
A dotted purple line marks the Workbench end date (if defined).
Use the blue drag bar to adjust the offset of secondary indicators for lead (+) or lag (–) testing.
Seasonality tests:
S: Present (red box) – Seasonality is Present. Click to view results.
S: Not Present (green box) – Seasonality is not detected.
S: Failed (gray box) – Seasonality test could not be executed.
R statistic: The correlation coefficient. Represents the strength and direction of linear correlation (–1 to 1).
R²: Square of the correlation coefficient.
Procyclical percentage: Share of time both indicators move in the same direction.
Countercyclic percentage: Share of time both indicators move in the opposite direction.
Workbench Features
Workbench Hamburger Menu
Open: Open your Workbench.
Tag: Add tags.
Copy: Copy the Workbench.
Move: Move to another project.
Export to CSV: Download the Workbench data into a CSV file.
Delete: Delete the Workbench.
New Workbench: Add a Workbench to the project.
View My Workbenches
View all accessible Workbenches.
Filter between Workbenches you own and those shared with you.
Chart Hamburger Menu
Change Primary: Replace the primary indicator.
Rename: Rename the Workbench.
Create Custom Chart: Build a chart from selected indicators.
Copy: Copy the Workbench.
Tag: Add tags for easier navigation.
Add Workbench Indicators to Alerts: Set alerts for selected indicators.
Export to CSV: Download the Workbench into a CSV file.
Delete: Delete the Workbench.
Side Menu
Primary Indicator: View your selected primary indicator.
Visible: View the number of visible indicators.
Hidden: View the number of hidden indicators.
Tools: Manage and analyze your data using these features:
.png) Bulk Actions: Apply actions to multiple indicators simultaneously.
Bulk Actions: Apply actions to multiple indicators simultaneously. Condense list: Minimize your indicator view. Deselect for a detailed view.
 Best R-Squared: View the offset that results in the highest R-squared relationship between the primary and secondary indicator. (**A bit iffy about this)
 Best Pro-Cyclic: View the offset that results in the highest proportion of time points that the primary and secondary indicators are moving in the same direction.
 Best Counter Cyclic: View the offset that results in the highest proportion of time points that the primary and secondary indicators are moving in the opposite direction.
 Reset: Reset your indicator(s).
 Create Model: Create a model by utilizing the following options:
Automated model: Uses the Predict model optimization to select the best combination of indicators to include in your model.
Manual model: Manually select the indicators to include in your model.
 Manage Indicators: Manage your indicator settings.
 Forecast All Visible Indicators: Predict future values or trends based on historic indicator data.
 Revert All Forecasted Indicators: Undo forecasted indicator(s).
 Set Default Start And End Dates: Set the start and end dates for your indicators.
Frequency: Select what time interval an indicator’s data will be displayed in:
Daily
Weekly
Monthly
Quarterly
Semi-Annual
Annual
Calculation: Calculate your indicator(s) by different metrics. See Calculation Adjustment.
Curve Style: Alter the appearance of your indicator(s).
Layout: Change the layout of how your indicators appear on your screen.
Workbench notes
Add observations to your workbench for future reference. Select Generate Commentary to generate GPT notes.
Indicators
Edit and manage the indicators you have added to your Workbench. See Glossary of Terms for definitions.
Details: View the details of your select indicator(s).
Transform: Change/customize your chart’s characteristics. Select Update Preview to view the result when finished. Apply the changed characteristic when satisfied.
Hide: Hide your indicator(s) from view. To make your indicator(s) visible, select the Manage Indicator tool and toggle the visibility option.
Remove: Remove your indicator(s) from your workbench.
Indicator Display Information: Edit your indicator’s display information such as the name, description, category, and color.
Lock: Lock or unlock your indicator.
Add to Model: Add your indicator to a preexisting Model.
Revert Forecast: Returning your indicator to a previous state or version. This feature includes undoing recent changes made to the forecast settings or reverting to a prior set of parameter values that were deemed more accurate or reliable.
Add to Favorite: Add your indicator to your favorites.
Export Image: Save your indicator as an image.
Diagnostics Page
Correlation Matrix
View a chart used to analyze the relationships between different indicators within your model. This matrix assists in identifying which indicators may serve as useful predictors and how to adjust the model accordingly based on their interdependence.
Hamburger Menu
Add Indicator: Add an indicator to your workbench.
Filter: Filter by specific indicators.
Change Primary: Change the primary indicator of your workbench.
Rename: Rename the primary indicator of your workbench.
Create Custom Chart: Select indicators to create a custom chart.
Copy: Copy your workbench.
Tag: Add tags to your workbench for easy navigation.
Export to CSV: Download your workbench.
Delete: Delete your workbench.