Creating a Table in the Board M365 Excel Add-in allows users to retrieve and analyze structured data from Board directly in their Excel worksheet.
Creating a Board Table typically consists of three parts:
A Table defines which data is extracted and maintains a live connection to Board. Users can refresh, update, or reconfigure the data at any time. There are two ways to create a Table: via Dataset or Layout.
Tables can be created by any user with access to the Board Excel Add-in.
Datasets and Layouts use different configurations. When switching the Data Source during creation, the previous configuration is cleared.
When creating a Table, choose whether to display the data as a flat Excel Table (raw data) or not. The definition of rows and columns is not configured at this stage. To configure the Table, pivot the data after creation. Once executed, the Table displays the retrieved data.
Standard Excel functionality is available only if the Show source data option is enabled. If this option is disabled, Excel-native features cannot be used.
Excel-native functionalities should not be used to modify pivoted Tables created with the Add-in, as these changes are lost after a refresh.
Before creating a Table: Define a selection
It is recommended to configure a selection using the Board toolbar before creating a Table. A selection defines the data scope used when creating or refreshing a Table. This step is especially important when working with large Datasets or Layouts.
Define a selection
To define a selection:
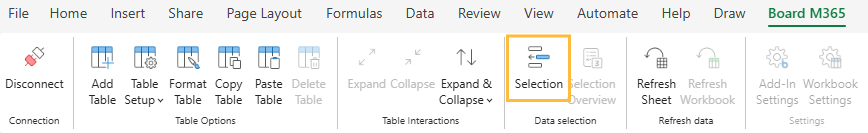
Click “Selection” in the Board ribbon to open the Selection pane in the right panel.
Select a Data Model.
The selected Data Model may include predefined selections that are applied automatically, such as Data Model security selections. The selection defined in Excel is combined with these and limits the data retrieved when creating or refreshing a Table.
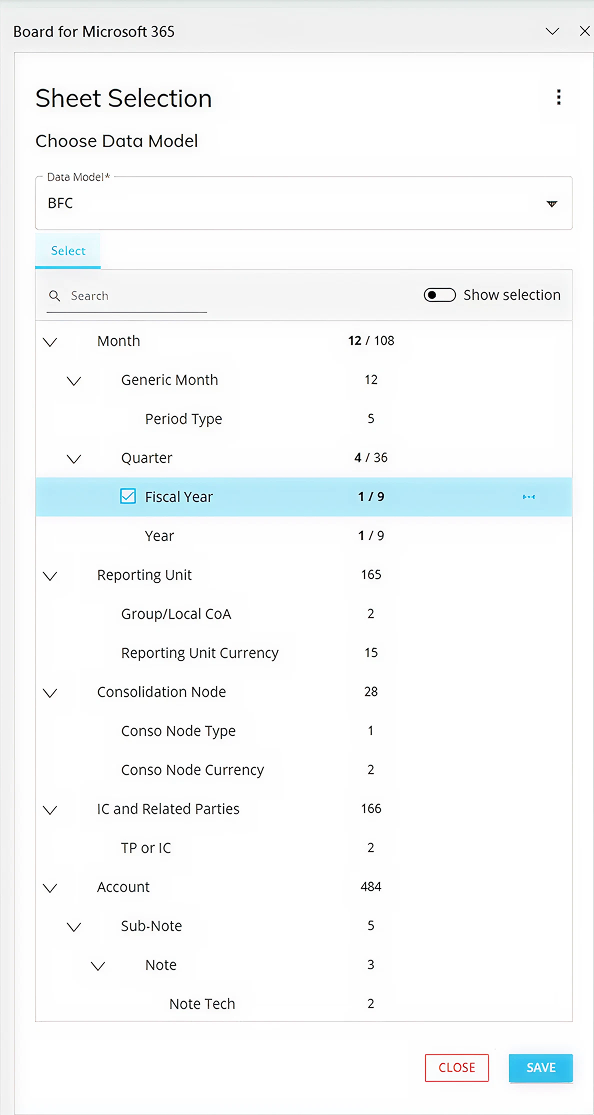
Define the required selection criteria by selecting the relevant members within the available Entities (e.g., specific Days, Months, Customers, or Cities).
.png)
Save the selection.
The defined selection limits the data retrieved when creating or refreshing a Table.
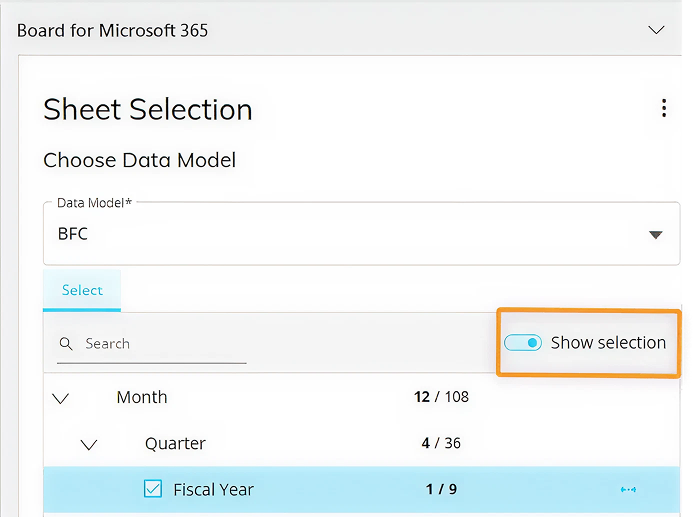
Show selection
The Show selection toggle controls how Entities are displayed in the Selection panel:
When enabled, only Entities and members with an explicit selection are displayed.
When disabled, all available Entities are displayed hierarchically, including those with no selection applied.
Example
In this example, the BFC Data Model (Business Financial Consolidation) is used.
The selection made filters the data to a single fiscal year. Because Time Entities are structured hierarchically, selecting one fiscal year automatically limits the related Time members available in the Data Model.
The Show selection toggle controls how Entities are displayed in the Selection panel.
When enabled, the panel displays only the Entities and members where a selection has been explicitly defined.
When disabled, the panel displays all available Entities organized hierarchically, including those with no selection applied.
This view shows how the selection propagates (See image below).
When Show Selection is enabled, only the Entities display with a number count that represents the selected amount of members. This helps users see exactly what defines the selection.
Create a Table
Create a Table in one of the following ways:
Select “Create Table” in the Task pane. Users are automatically redirected to the Table configuration panel.
.png)
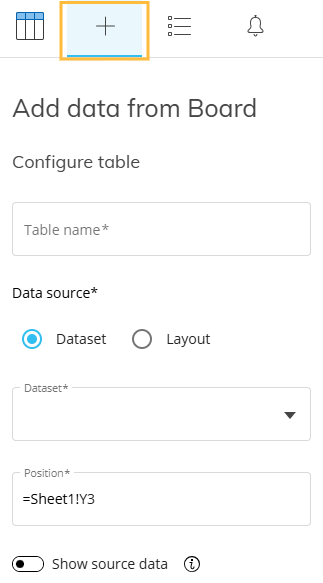
Click on the “+” tab of the Task pane.
Select “Add Table” in the Table Options section of the Board toolbar. Users are automatically redirected to the Table configuration panel.
.png)
Select “Add Board table” in the right-click context menu to create a new Board Table. Users are automatically redirected to the Table configuration panel.
.png)
The starting cell must be empty.
Enough room must exist in the sheet for the Table to exist. Read more about overlapping tables.
When selecting a cell before opening the Table configuration window, its coordinates are automatically prefilled.
Enter a unique name for the Table.
The name is used to identify the Table in the Table list.
No two Tables in the same sheet can have the same name.
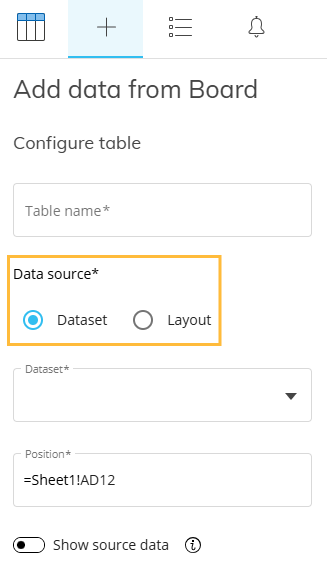
Select the desired Data Source: Dataset (default) or Layout.
Data sources can be restricted for certain end users depending on their application profile settings made in the Features section.
Dataset. Choose a Dataset from the dropdown.
Datasets are predefined and reusable data definitions. They return data as a flat table in Excel only if the Show source data option is enabled. If it is disabled, the data is retrieved but not automatically displayed as an Excel table.
Each Dataset includes a name and description to help users identify its purpose and content.
When creating a Table from a Dataset:
The structure and column definitions are inherited from the Dataset.
Multiple Tables can use the same Dataset to ensure consistency.
The Dataset is executed when users save the Table configuration.
After saving, data is not retrieved again unless refreshing the sheet or workbook, or apply a Select.
When changing the data source from Dataset to Layout or vice versa, the system displays a warning message. The previous configuration clears when the data source type changes.
.png)
Click “YES, CHANGE” to confirm the change.
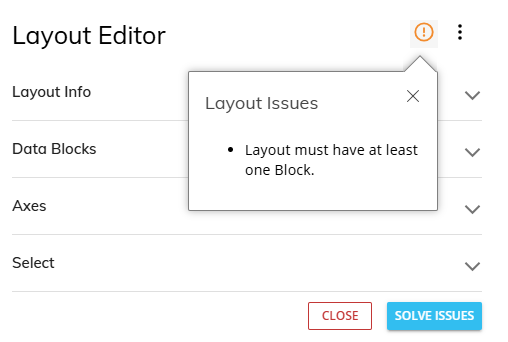
Layout. A “Create Layout” button displays. Click on it to open the Layout Editor, where users can configure the following settings:
Layout Info. Select a Data Model from the dropdown.
Data Blocks. Add one or more Data Blocks (Cube, Entity, Rule, Ranking, or Algorithm) and configure the Block settings.
Axes. Add one or more Entities in the Axes area.
At least one Entity must be added.
Select. Add a selection to apply to the Table. (optional)
.png)
A Layout allows users to define a custom data structure directly in Excel.
If a configuration is not allowed, the SOLVE ISSUES button will appear where the SAVE button usual is and an orange exclamation point icon will appear next to “ Layout Editor”. Click on the icon to read what needs fixing.
Read more about the Board M365 Excel Add-in Table Layout and configurations.
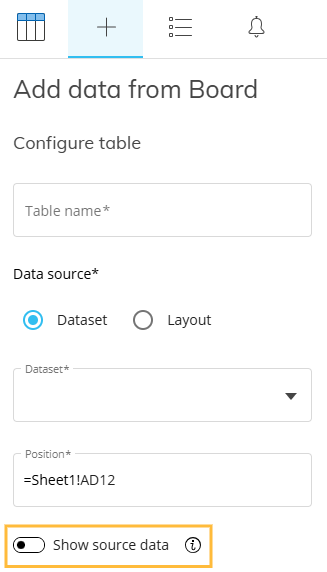
Show source data (optional)
The Show source data option controls whether retrieved data is automatically displayed as a flat Excel Table.
When enabled, the Table executes the underlying Data Source and displays the results as an Excel Table (unless a pivot configuration is applied).
When disabled, the Table executes the underlying data definition and retrieves the data when the configuration is saved, but the results do not automatically display. The data remains available in the background and only displays after a refresh (sheet or workbook) or by enabling the option and refreshing the page.
If pivoting is applied, the data is processed according to the pivot configuration and is not displayed as a flat Excel Table.
By default, this option is disabled.
Click “SAVE” to save the Table or “DISCARD” to discard the Table and its settings.
Go back to the main Board M356 Excel Add-in page to access the BETA manual index.