This topic describes how to add a new OpenStreetMap Object to a Screen or Container and configure it to display geographic data.
An OpenStreetMap Object is configured in the Layout Editor. In the Layout Editor, you define the data used by the map, configure the relevant Axes, and complete the OpenStreetMap specific settings in the Object settings tab.
Create an OpenStreetMap
To create a new OpenStreetMap:
Open a Screen in Design Mode.
In the Screen editing page, locate the OpenStreetMap in the Screen Objects list on the left panel.
Drag and drop the OpenStreetMap onto the Screen or into a Container.
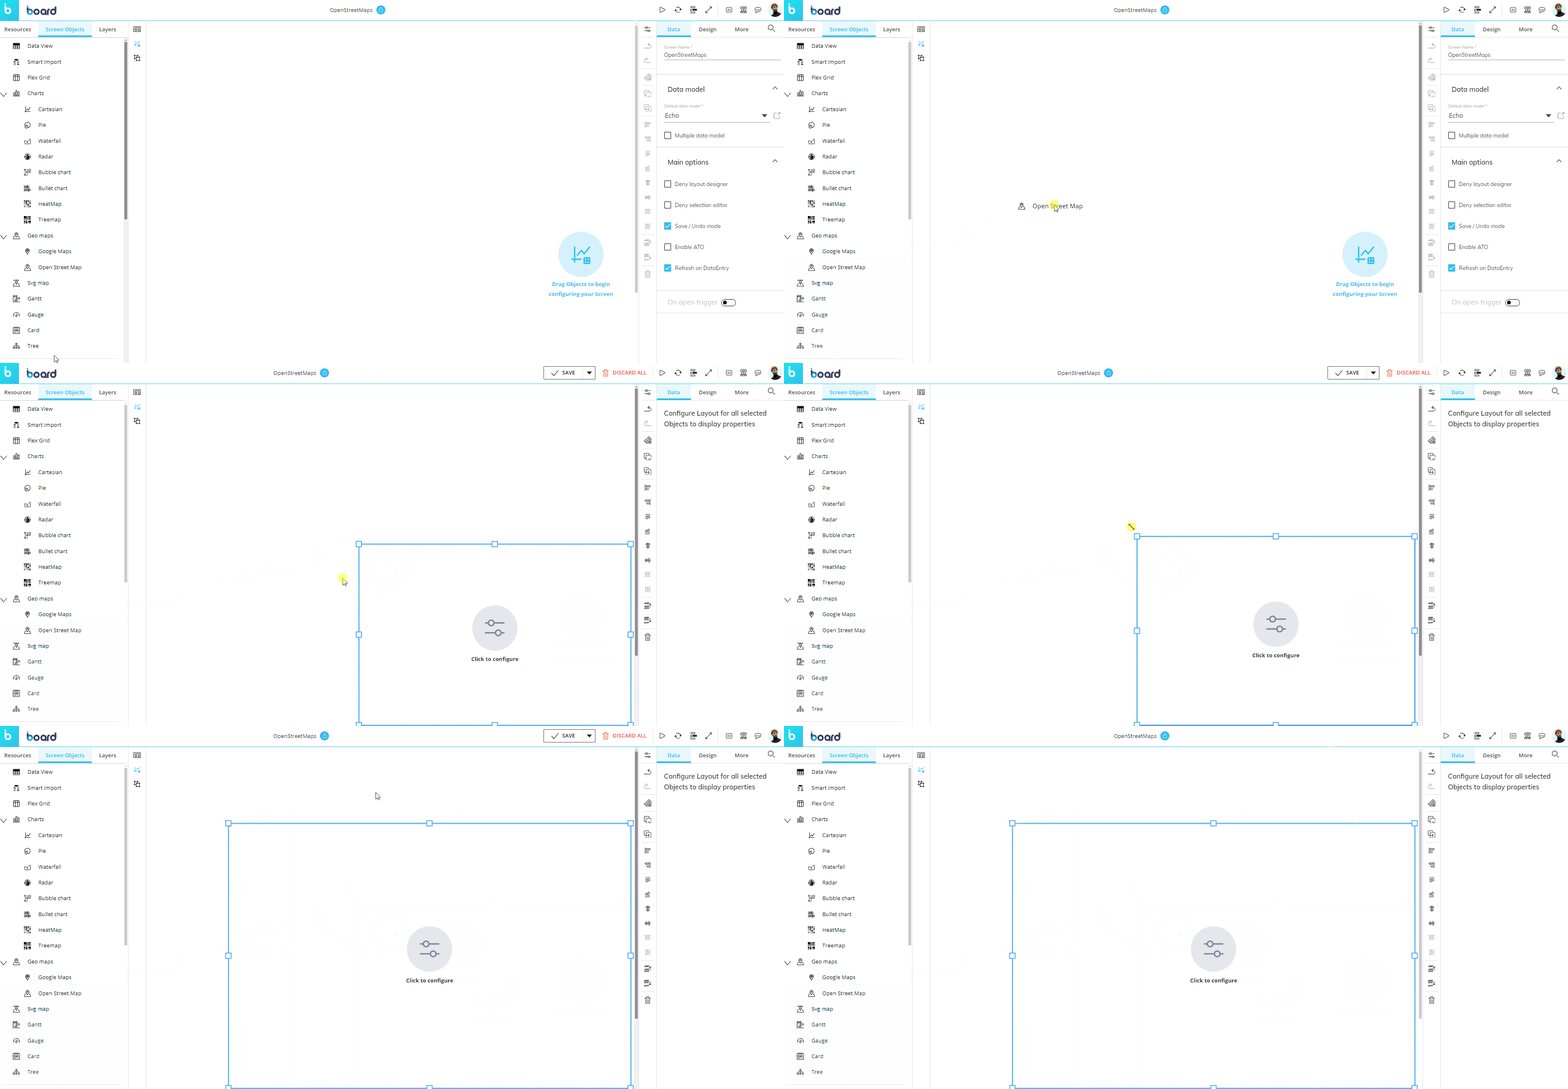
When the OpenStreetMap is first added to the Screen, it is empty. You must configure its Layout before it can display data.
Like any other Screen Object, an OpenStreetMap can be moved, resized, duplicated by copy and paste, and aligned with other Objects on the Screen. See Configure Screen Objects for more information.
Configure an OpenStreetMap
To configure an OpenStreetMap, open the Layout Editor using one of the following methods:
Click on the center of the OpenStreetMap.
Select the OpenStreetMap, then click on the Configure Layout button
 in the Properties toolbar on the right side of the Screen.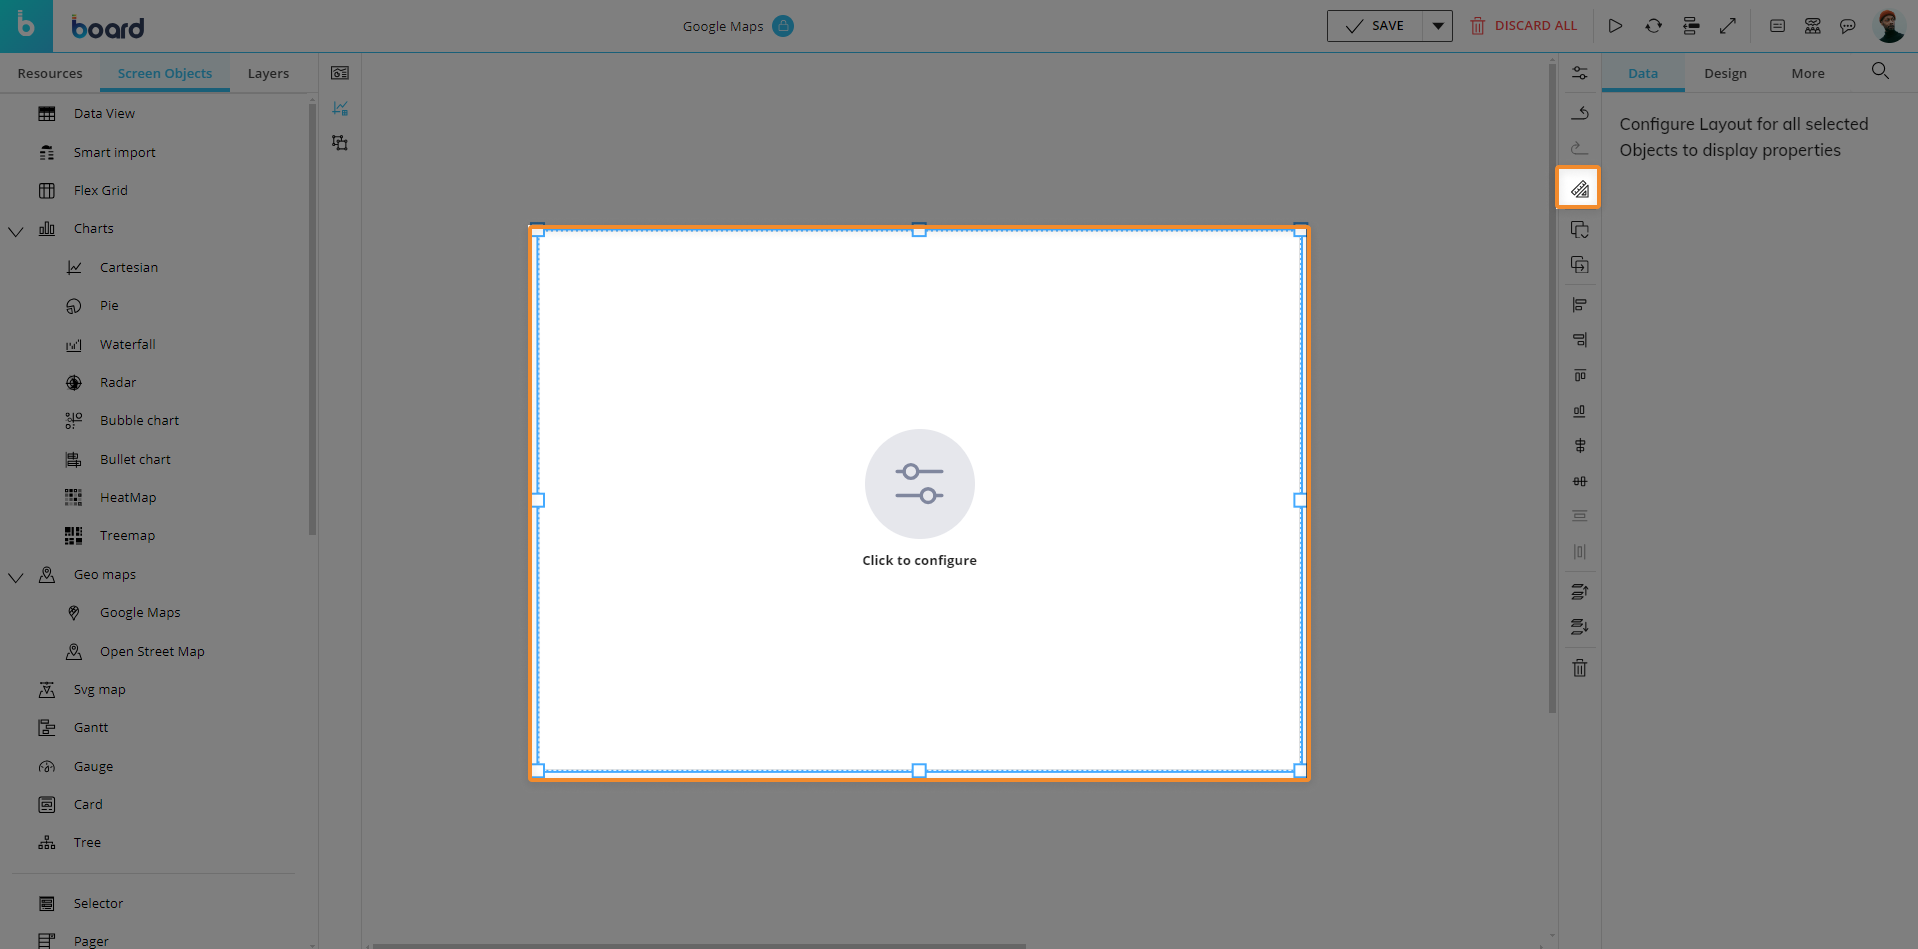
Right click on the OpenStreetMap, then select Layout from the context menu.
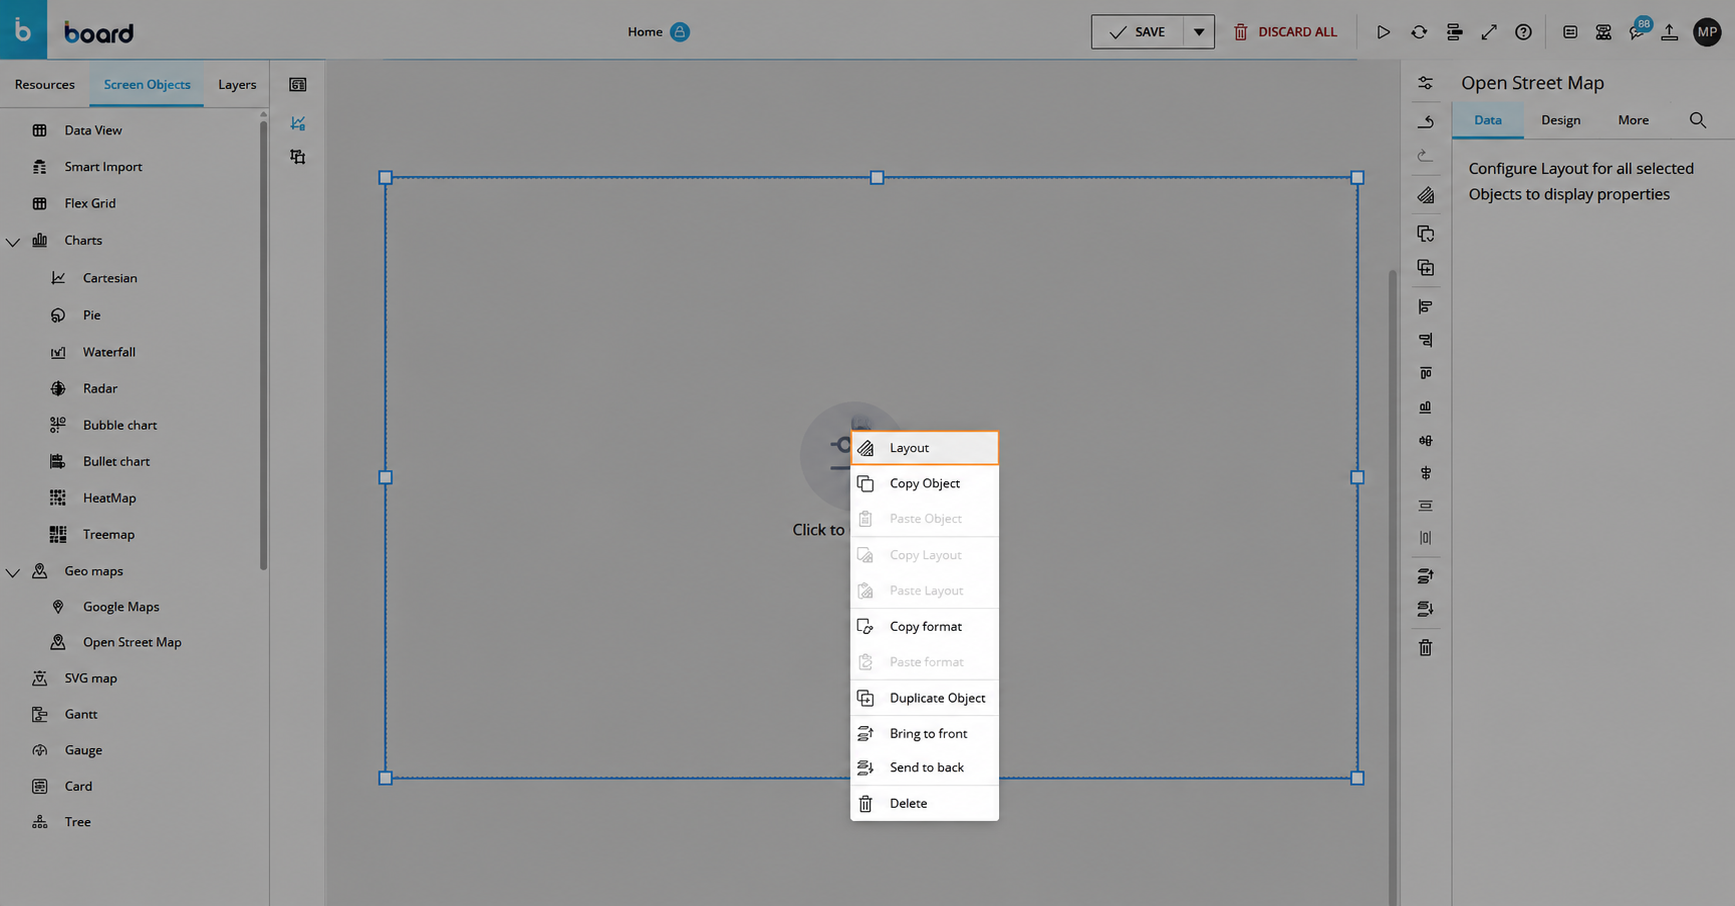
The Layout Editor for an OpenStreetMap works similarly to the standard Layout Editor. It also includes OpenStreetMap-specific settings in the Object settings tab.
See The Layout Object, Configure a Layout, and About Data Blocks of a Layout for more details on the Layout Object.
Main steps
Use the Layout Editor to define the data and dimensions used by the OpenStreetMap. The main Layout configuration steps are:
Add Data Blocks
Configure Markers in the Axes tab
Optionally configure Select, filters, and sorting
Configure the visualization in the Object settings tab
Layout Editor tabs
The Layout Editor is organized into tabs. Each tab contains a different set of configuration options for the selected Object.
Data Blocks
In the Data Blocks tab, add the Blocks that contain the data you want to display on the map.
Depending on the map configuration, add one or more of the following Blocks:
Measure Blocks, such as the values to display on the map
Latitude Blocks, if the map uses latitude values
Longitude Blocks, if the map uses longitude values
Entity Blocks or Text Blocks, if Map Areas are based on GeoJSON area IDs
The Data Blocks define the values that the OpenStreetMap can use. The map visualization is completed later in the Object settings tab.
See About Data Blocks of a Layout for more details about Data Blocks.
Choose the geocoding method
Geocoding is the process of associating data with geographic positions or areas so that the OpenStreetMap can display multidimensional data on a map.
An OpenStreetMap supports two geocoding methods:
The method you choose depends on how the geographic information is stored in your Data Model and whether you want to display Bubbles or Map Areas.
Using Latitude and Longitude Cubes. Use Latitude and Longitude Cubes when you want to provide geographic coordinates for the map.
This method can be used for:
Bubbles
Map Areas configured by coodinate values
To configure these method:
Add the Latitude and Longitude Cubes to the Data Blocks tab.
Add the measure Blocks that you want to display on the map.
Make sure that the Latitude and Longitude Cubes are dimensioned by the Entity used to identify the map elements, or by another Entity from the same Relationship tree.
Open the Axes tab and add the relevant Entity to the Markers field.
.png)
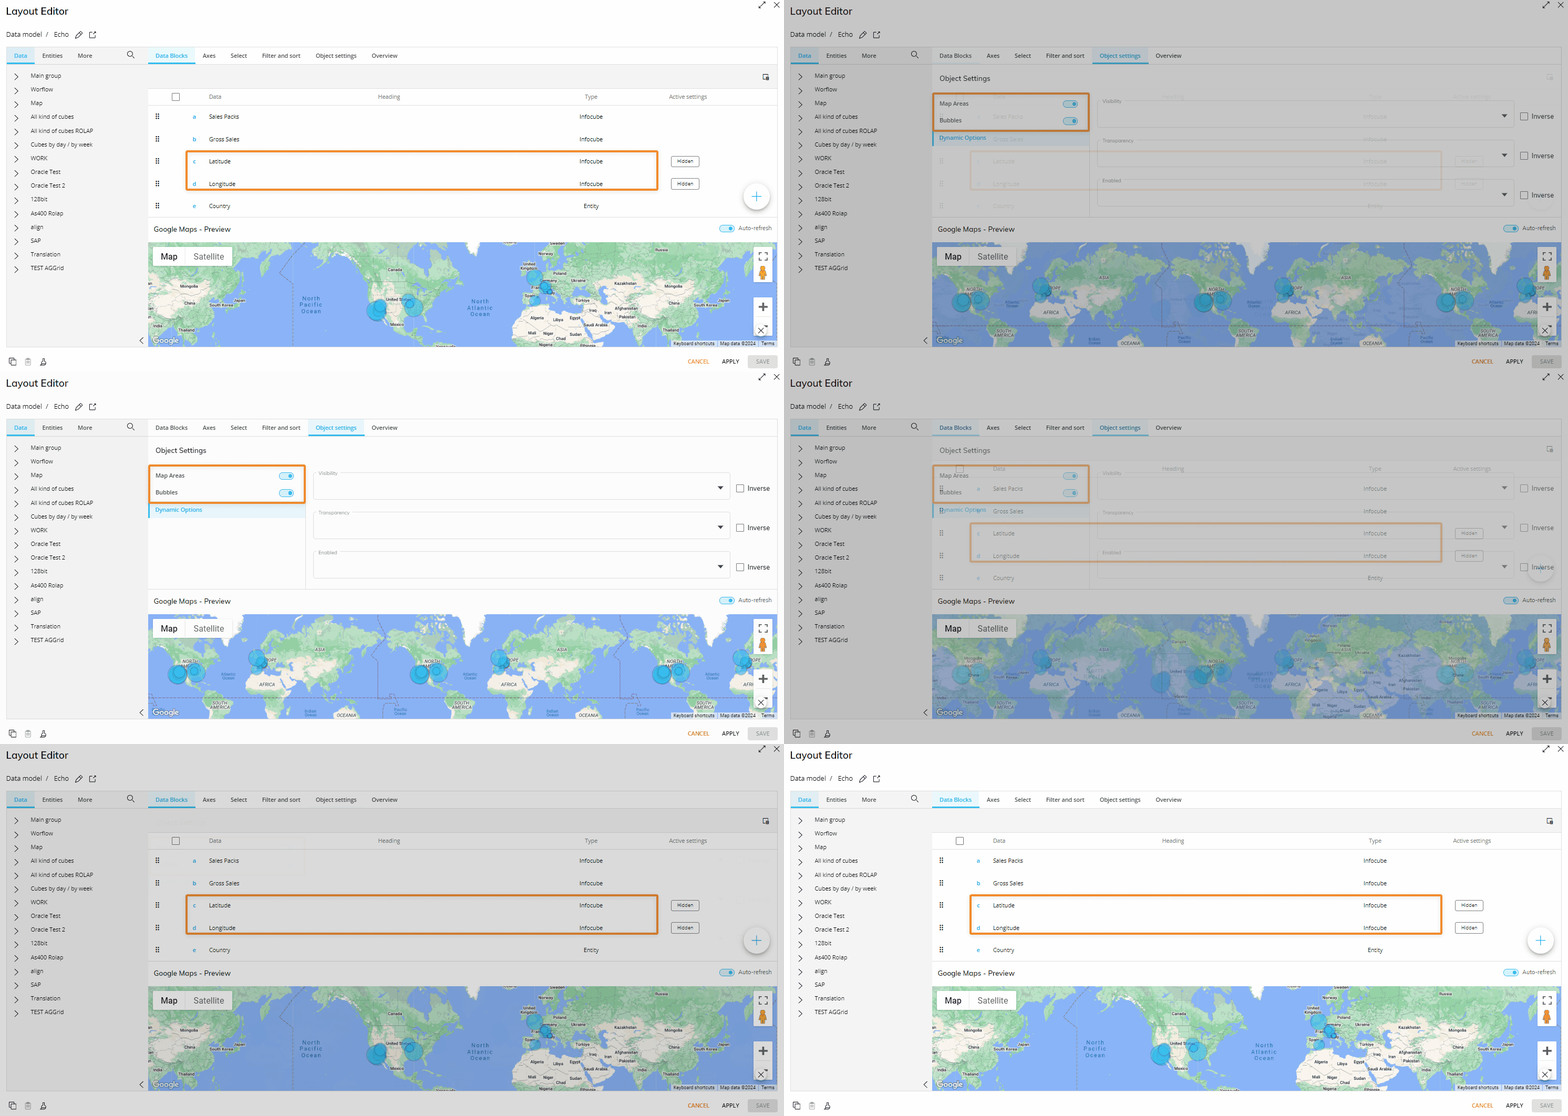
In the Object settings tab, assign the Latitude and Longitude Blocks to the corresponding OpenStreetMap settings.
Latitude and Longitude values can be sourced from external providers, either free or paid, or entered manually through Data Entry actions in the corresponding Cubes.
Example: Using Latitude and Longitude Cubes
You want to display data from the Net Sales Cube, which is dimensioned by Day, Shipper, Product, and Branch.
The parent Entity is Branch, which is organized in the following hierarchy:
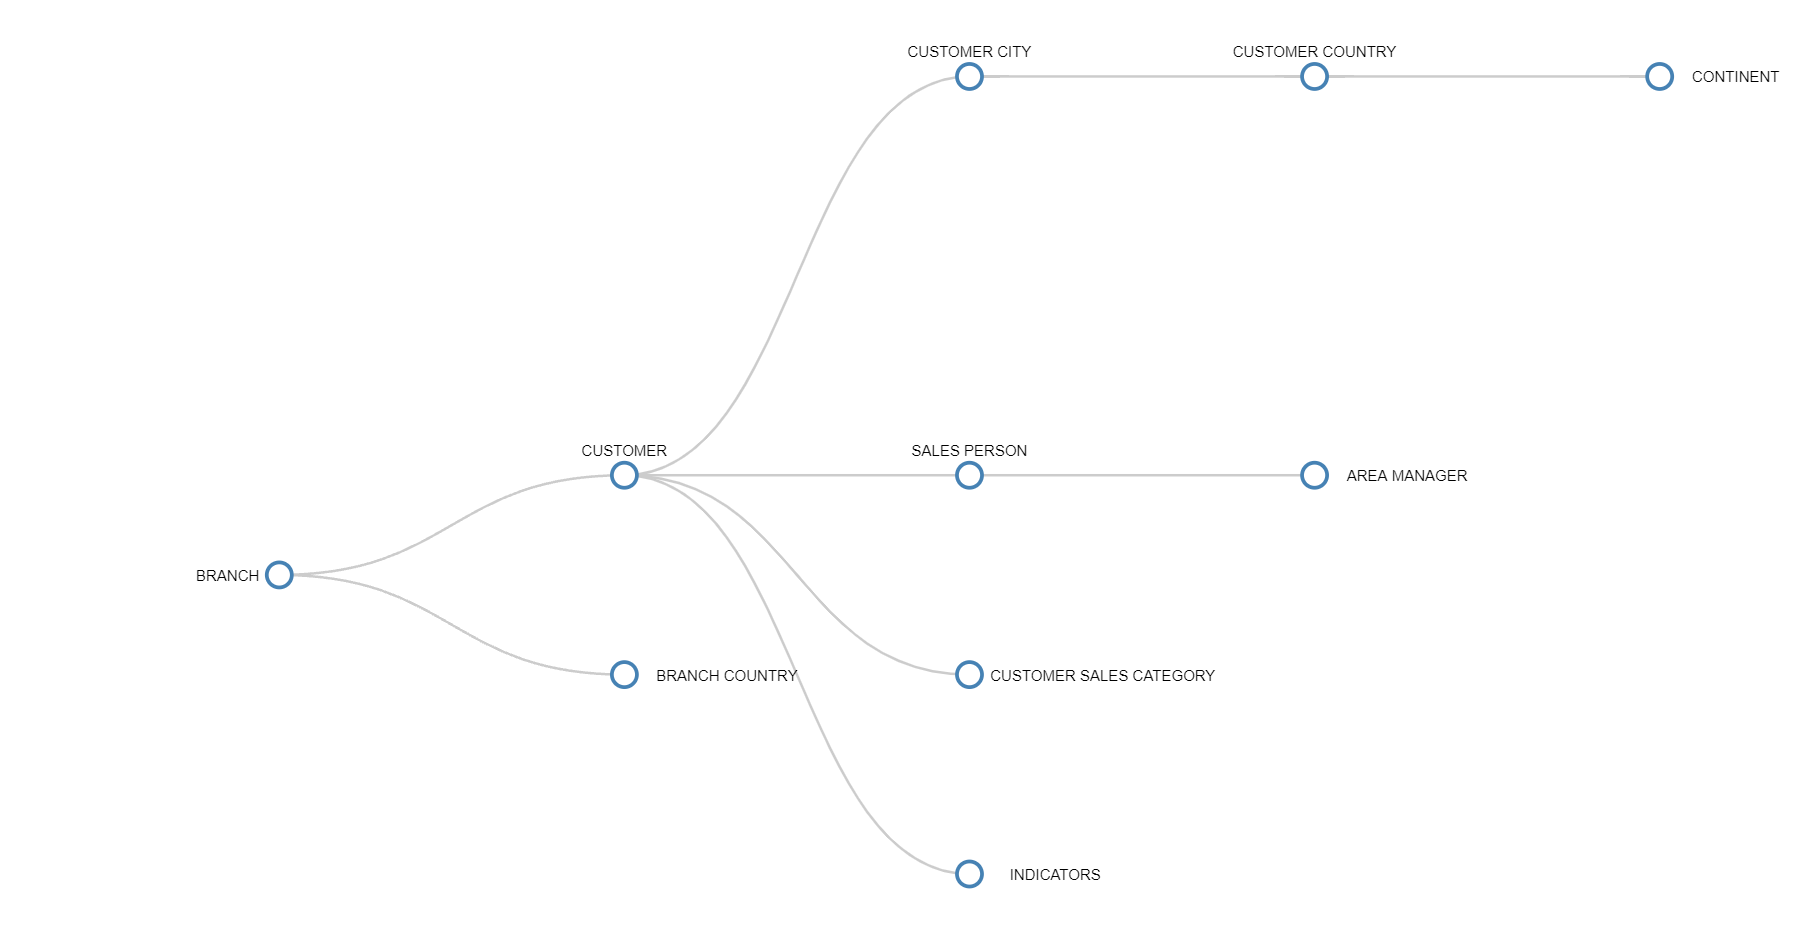
To display Branch data in the OpenStreetMap, the Layout uses two additional Cubes that provide the geographic coordinates for the Entity members:
A Cube containing Latitude values
A Cube containing Longitude values
The following Data View shows the Longitude and Latitude values associated with each Branch member:
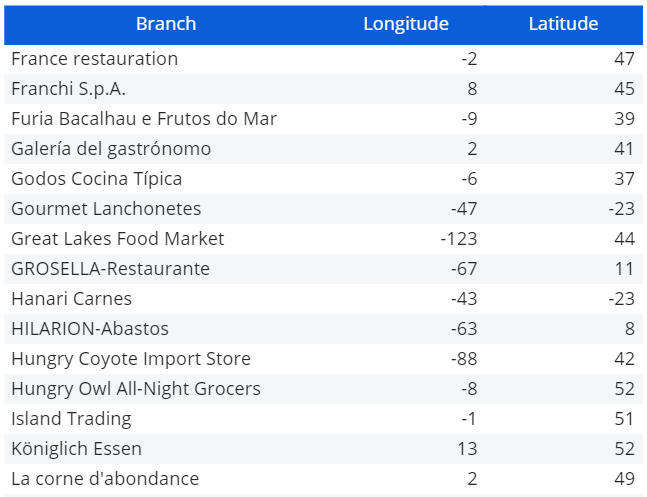
These coordinate values determine where each Branch is positioned on the map.
The Layout must also align the measure data with the coordinate data. This means that the Cubes included in the Layout must share the Entity used to identify the map points, or use another Entity from the same Relationship tree at the required level of aggregation.
The following Layout Editor shows this alignment pattern. The Entity used in the Axes is also present in the structure of each Cube, allowing Board to associate each data value with the correct geographic coordinates:
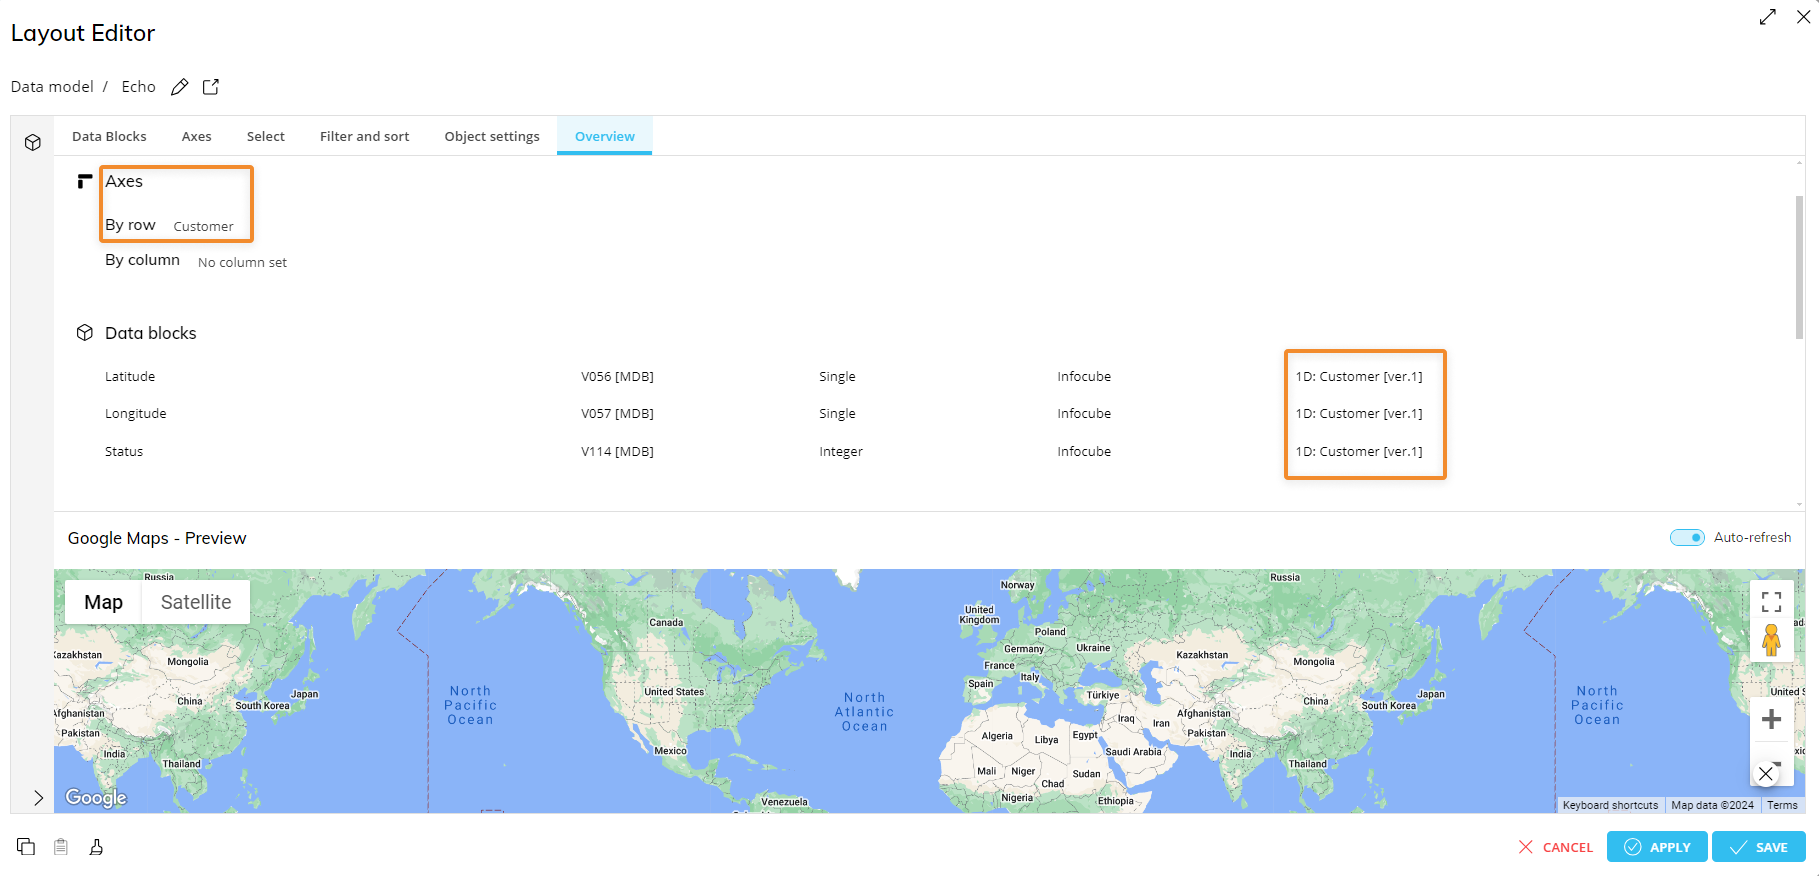
Data visualization on the map is completed in the Object settings tab, where you configure the appropriate display option, such as Bubbles or Map Areas.
Using an Entity or Text Block mapped to GeoJSON IDs. Use an Entity or Text Block when you want Map Areas to match area IDs in a GeoJSON file.
This method applies only to Map Areas.
To configure this method:
Add an Entity or Text Block to the Data Blocks tab.
Make sure that the Entity member codes or text values match the IDs of the areas defined in the GeoJSON file.
Add the measure Blocks that you want to display on the map.
Make sure that the data Cubes use the relevant Entity in their structure, or another Entity from the same Relationship tree.
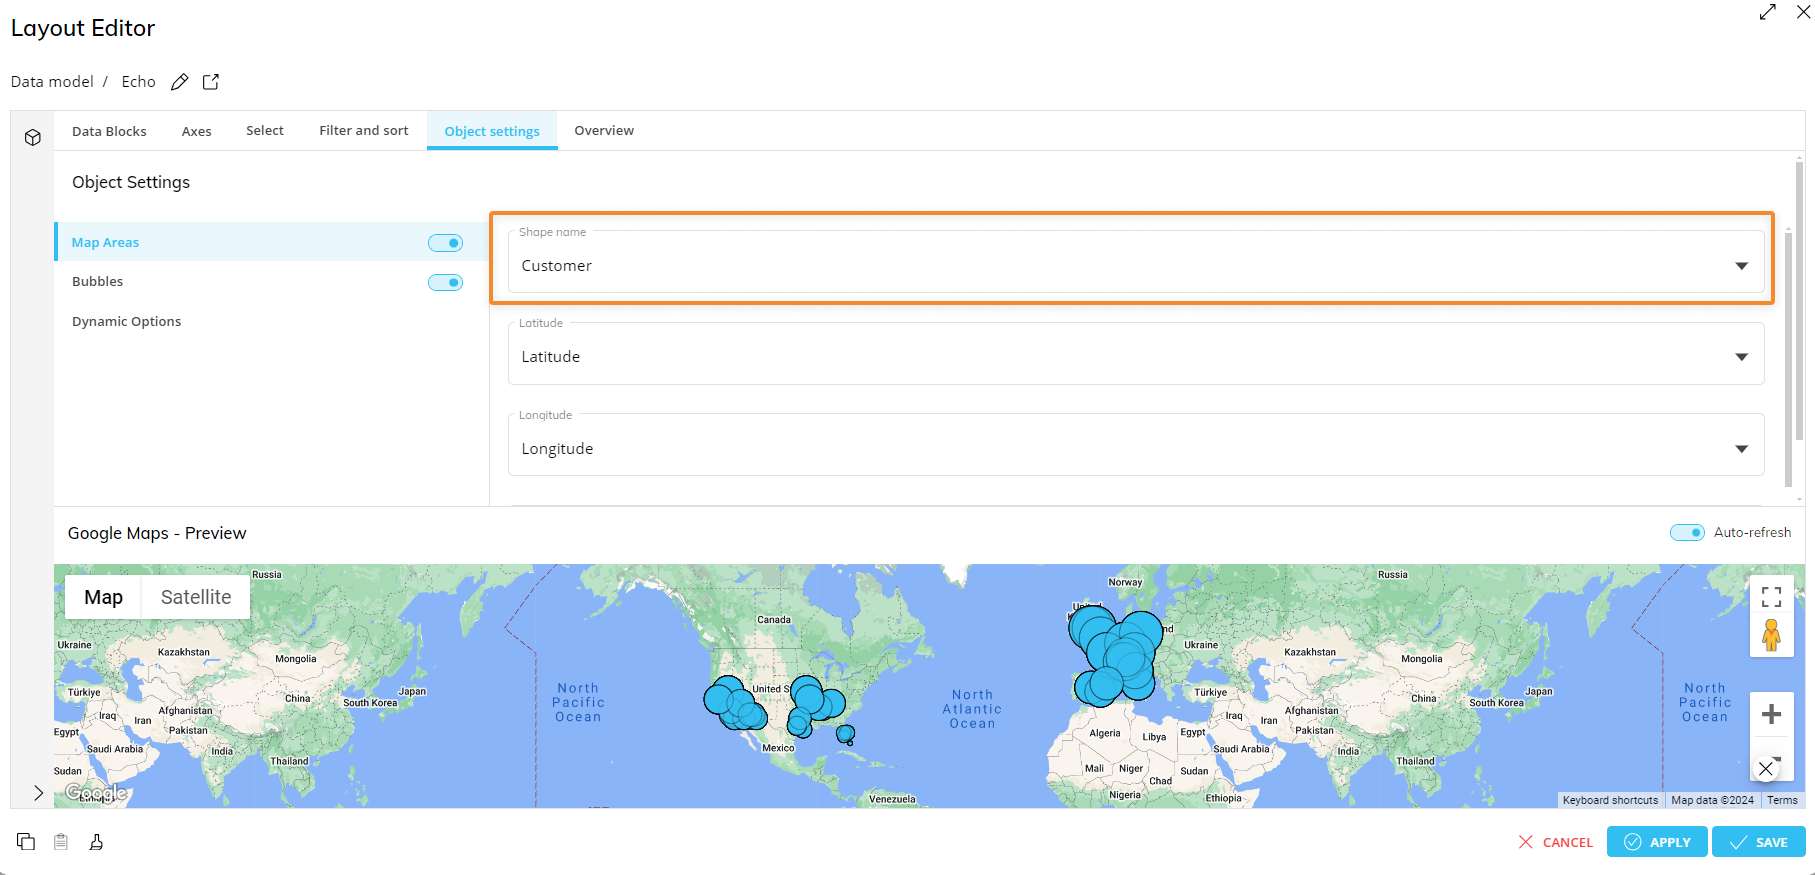
In the Object settings tab, enable Map Areas and select the Entity or Text Block in the Shape name field.
The GeoJSON file must contain IDs and coordinates for each map area. The values in the Entity or Text Block must match those IDs. For example, if the GeoJSON file contains an area ID named
IT, the corresponding Entity member code or Text Block value in the Layout must also beIT.The method you choose depends on how the geographic information is stored in your Data Model and on whether you want to display Bubbles or Map Areas.
Example: Using an Entity or Text Block with GeoJSON IDs
You want to visualize data from the Net Sales Cube as Map Areas.
The parent Entity is Branch, which is organized in the following hierarchy:
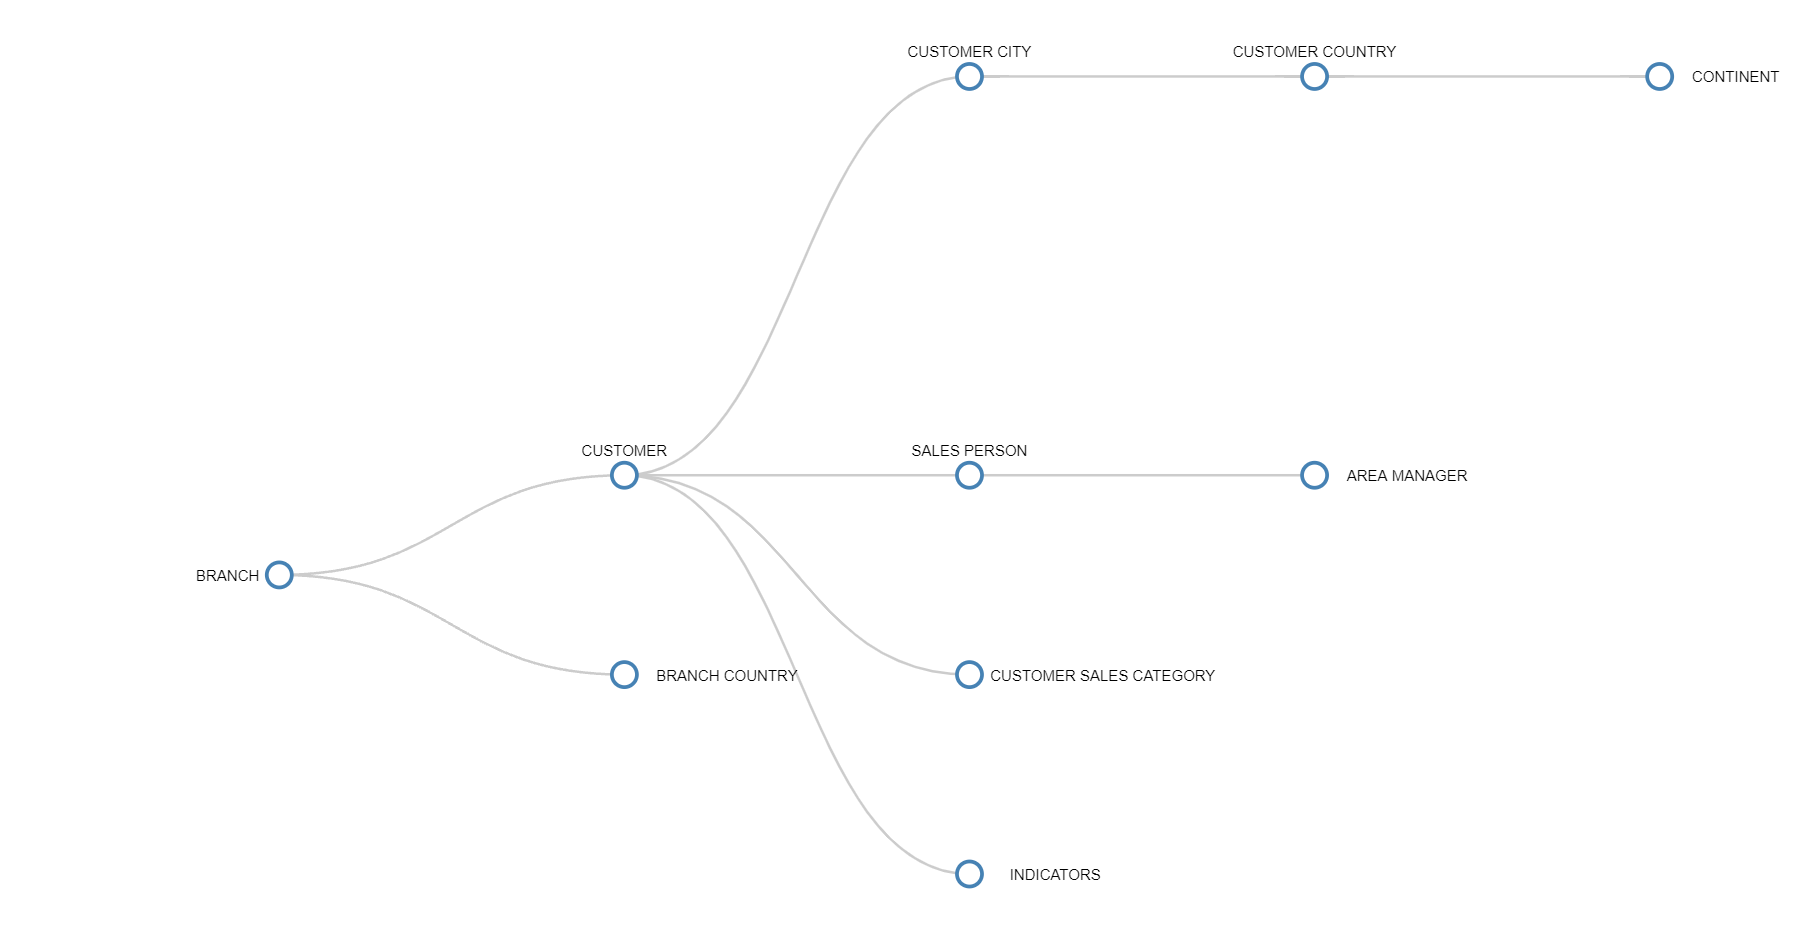
To display Branch data in the OpenStreetMap as Map Areas, the Layout includes:
The Net Sales Cube
An Entity or Text Block containing the IDs of the Object areas included in the GeoJSON file
The Entity member codes or text values must match the area IDs in the GeoJSON file.
The Country Entity contains members whose codes are used to identify map areas in the GeoJSON file. For example, the Country member Brazil has the code BRA, which must match the corresponding area ID in the GeoJSON file.
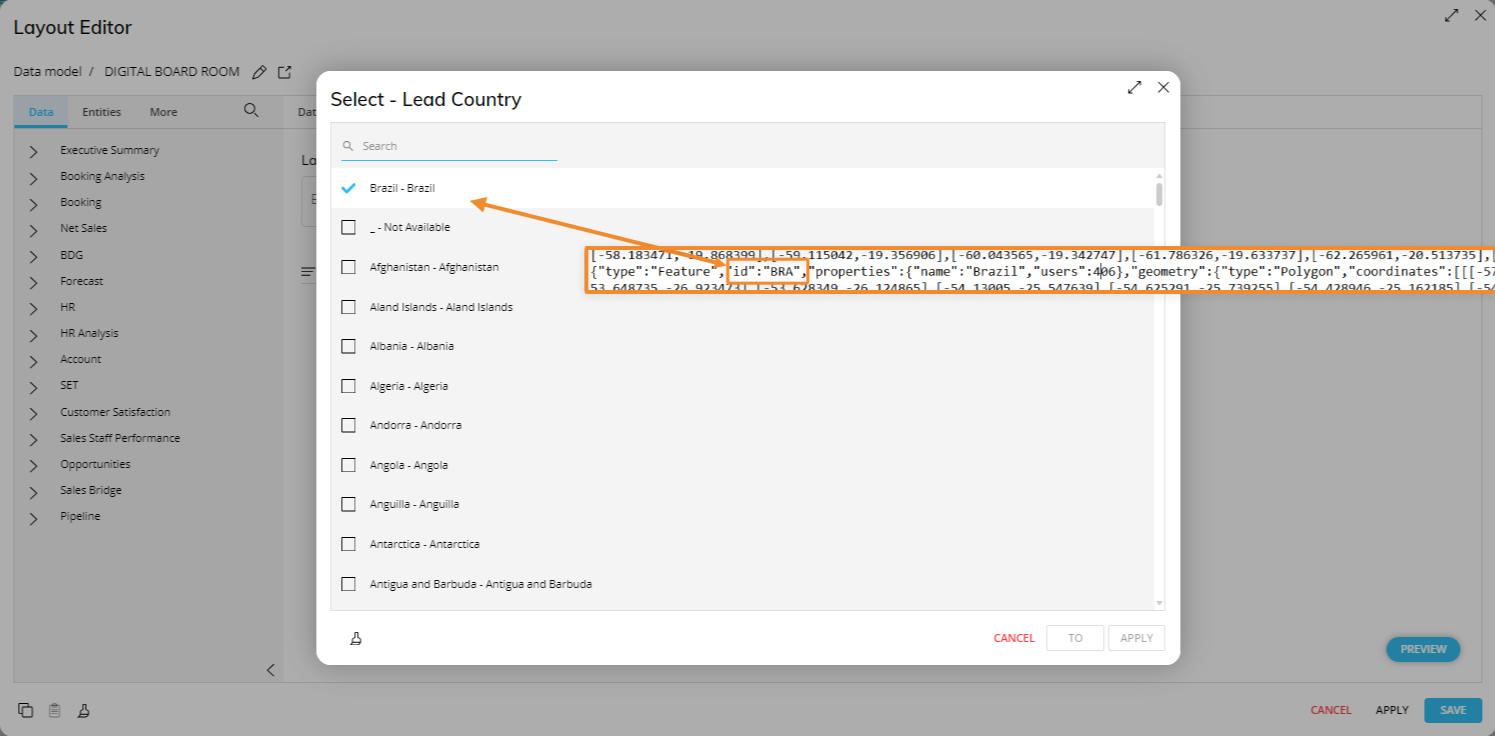 If the GeoJSON file contains
 "id": "BRA", the Country Entity must contain a member with the same code. This allows the OpenStreetMap to associate the data in the Layout with the correct geographic area on the map.In the Object settings tab, enable Map Areas and select the Entity or Text Block in the Shape name field. Then select the Block that drives the color of the Map Areas.
Using an Entity, the Layout configuration should look as follows:
Axes
In the Axes tab, you can add dimensions to the Markers field. These dimensions define the map elements that the OpenStreetMap uses to plot Bubbles or associate data with Map Areas.
.png)
The OpenStreetMap supports up to two Entities in the Markers field.
Use the Markers field as follows:
For Bubbles, add the Entity that identifies the points to plot on the map.
For Latitude and Longitude geocoding, use the Entity included in the structure of the Latitude and Longitude Cubes, or an Entity from the same Relationship tree.
For Map Areas based on GeoJSON IDs, make sure the Entity or Text Block is included in the Layout so it can be selected later in the Shape name field.
Depending on the number of Entities in the Markers field, one of the following scenarios applies:
Standard data set. One Entity is added to the Markers field. The value is shown in the marker form, and the position is determined by the Longitude and Latitude Cubes.
Clustered data set. Two Entities are added to the Markers field. Data points are clustered together in Bubbles, and relevant information about the data point and the two Entities is displayed in a popover.
For Latitude and Longitude geocoding to work correctly, the Entity used in the structure of the Latitude and Longitude Cubes must be added to the Markers field, or another Entity from the same Relationship tree must be used.
For geocoding based on GeoJSON IDs, include the Entity or Text Block in the Layout and select it later in the Shape name field under Map Areas.
You can optionally configure standard Layout options, such as Select, filters, and sorting.
Select
See Layout Select for information about the Select tab.
Filter and sort
See Layout filters and sorting for information about filtering and sorting.
Object settings
The Object settings tab contains the OpenStreetMap specific settings used to control how geographic data is displayed.
The tab is organized into the following sections:
Map Areas. Use Map Areas to display data as a colored layer over geographic areas, such as countries, regions, provinces, or custom territories. Map Areas can be configured in two ways:
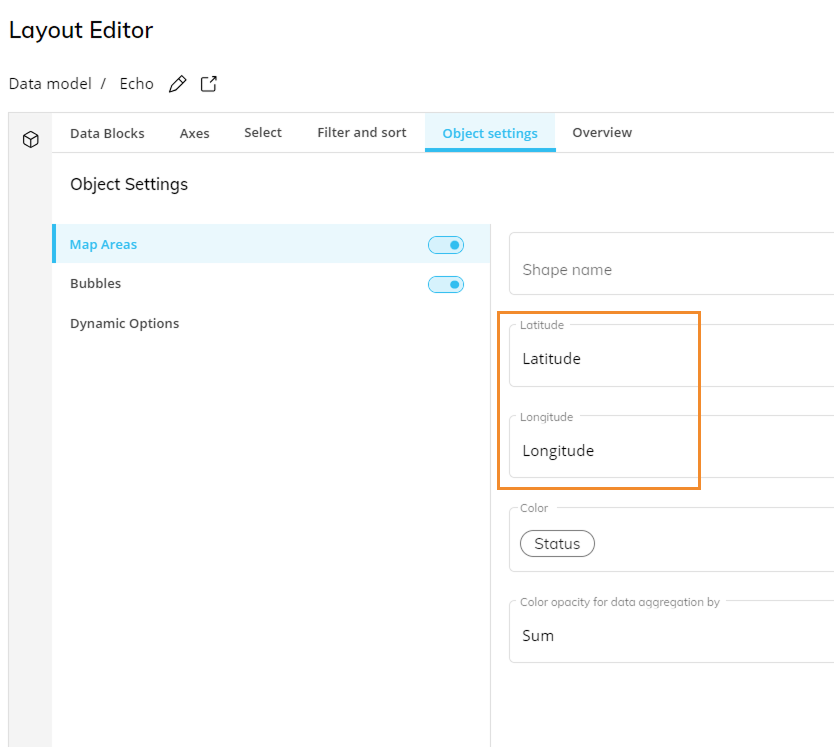
By selecting Latitude and Longitude Blocks.
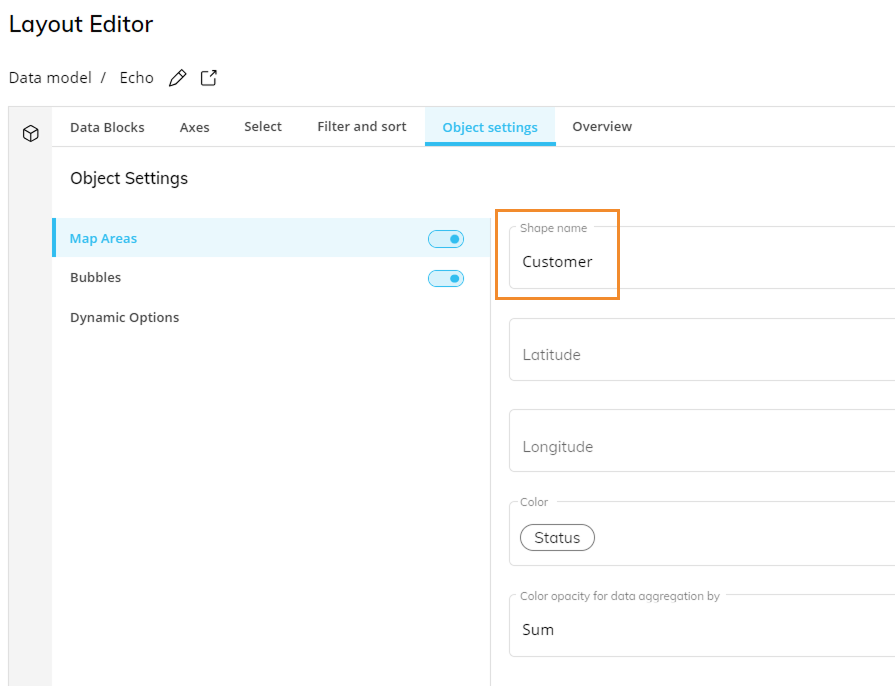
By selecting a Shape name Block mapped to GeoJSON area IDs.
After you configure and save the Layout, the OpenStreetMap background may appear automatically. The appearance of the map background does not mean that the Map Areas configuration is complete. To display data as colored geographic areas, you must also enable and configure Map Areas in the Object settings tab. This applies only when using Map Areas. If you are displaying data as Bubbles, configure the Bubbles section instead.
To configure Map Areas:
In the Object settings tab, enable the Map Areas toggle.
Choose how the map areas are identified:
Use Shape name to select an Entity or Text Block whose values match the area IDs in the GeoJSON file.
Use Latitude and Longitude to select the Blocks that contain coordinate values.
In the Color dropdown list, select the Block that drives the color of the map areas.
In Color opacity for data aggregation by, select the aggregation method used to calculate color opacity.
Save your changes.
After you save the configuration, the selected geographic data is displayed as a colored Map Areas layer over the OpenStreetMap background.
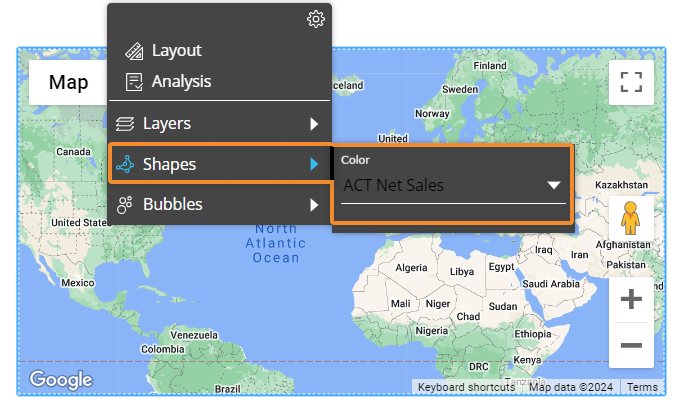
When multiple Blocks are selected in the Color dropdown list, those Blocks also appear in the Object toolbar in both Design Mode and Play Mode under the Shapes dropdown list. From there, users can select which Block drives the Map Areas color.
Bubbles. Use Bubbles to display data as points on the map using Latitude and Longitude values. To configure Bubbles:
In the Object settings tab, enable the Bubbles toggle.
Select the Blocks that contain Latitude and Longitude values.
For Bubbles, Latitude and Longitude Blocks must be configured so the OpenStreetMap can determine where to plot each point.
Select the Blocks that drive the bubble radius and color.
Save your changes.
After these steps are complete, the OpenStreetMap displays Bubbles in the selected positions.
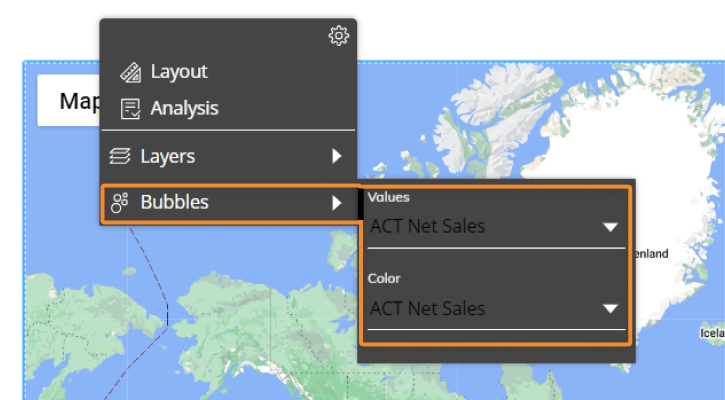
When multiple Blocks are selected for Bubbles, users can choose with Block drives the Bubble size and color from the Bubbles dropdown list, available in both Design Mode and Play Mode.
In the Values field, select the Block that determines the the Bubble size.
In the Color field, select the Block that determines the Bubble color.
You can configure Bubble colors dynamically by setting a Color Alert on the Block selected in the Bubbles Color field. If no Color Alert is configured, the default color palette is used.
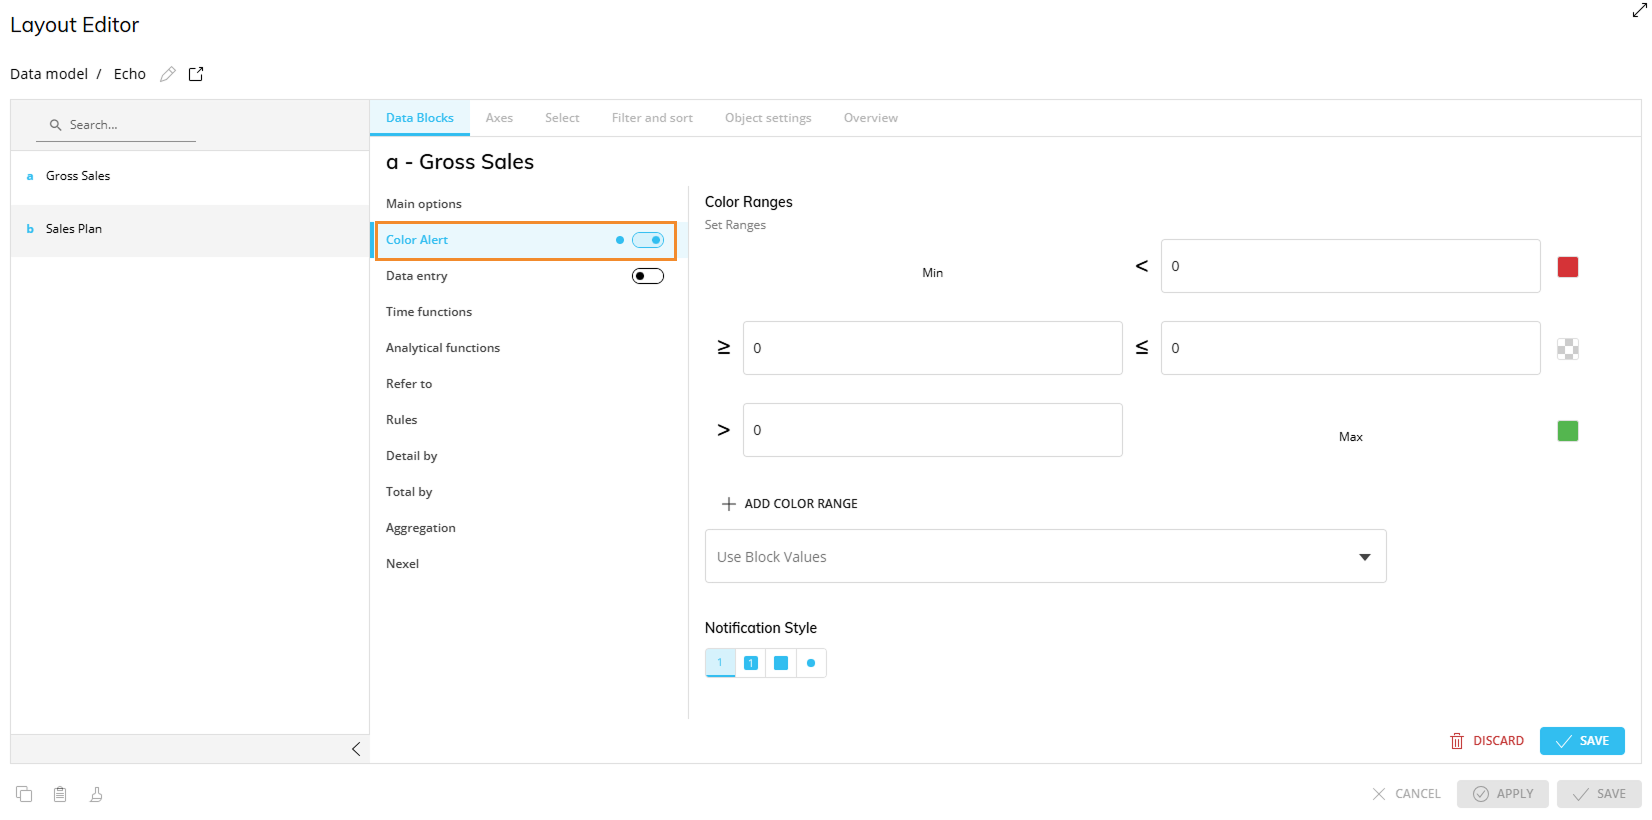
If both Bubbles and Map Areas are enabled, and the same Block drives the color settings for both options, any Color Alert configured on that Block is applied to both Bubbles and Map Areas. Use this configuration when you want to show point-based data and area-based data together. For example, you can use Map Areas to show regional performance and Bubbles to show store-level or branch-level values.
Dynamic Options. Use Dynamic Options to control the OpenStreetMap dynamically based on Layout Blocks. To configure Dynamic Options:
In the Object settings tab, select Dynamic Options.
Configure the following options as required:
Visibility. Select the Block that controls whether the Object is shown or hidden.
Transparency. Select the Block that controls whether the Object is displayed as transparent.
Enabled. Select the Block that controls whether the Object is enabled. When the Object is disabled, users may still see it, but they cannot interact with it.
To invert the behavior of an option, select the Inverse checkbox next to that option.
Save your changes.
.png)
Configure the sections that correspond to the map visualization you want to create.
What to do if the map does not display as expected
The map appears, but Map Areas do not display
If the map background appears, but no colored Map Areas are displayed, check the following:
The Map Areas toggle is enabled in the Object settings tab.
The Map Areas section has been configured.
A valid Shape name, Latitude, or Longitude Block has been selected and matches the data.
A Color Block has been selected.
The correct geographic areas are colored.
The color reflects the selected Color Block.
The Entity or Text Block values match the GeoJSON area IDs, if using Shape name.
The GeoJSON file contains IDs and coordinates for each map area.
The Latitude and Longitude Blocks contain valid coordinate values, if using coordinate mapping.
The data Cubes use the correct Entity structure, or a related Entity from the same Relationship tree.
Bubbles do not appear
If Bubbles do not appear, check the following:
The Bubbles toggle is enabled in the Object settings tab.
Latitude and Longitude Blocks have been selected and contain valid coordinate values.
The Latitude and Longitude values are correctly aligned with the Entity in the Markers field.
The Entity used for the coordinates is included in the Markers field, or is related through the same Relationship tree.
A Radius Block has been selected.
Bubble size reflects the selected Radius Block.
Bubble color reflects the selected Color Block or Color Alert configuration.
Dynamic Options do not behave as expected
If Dynamic Options do not behave as expected, check the following:
The relevant Block has been selected for Visibility, Transparency, or Enabled.
The selected Block returns the expected values.
The Inverse checkbox is selected only when the behavior must be reversed.
Visibility and transparency change according to the selected Block.
The Object is enabled or disabled according to the selected Block.